
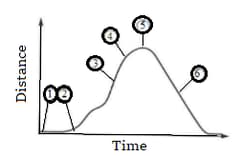
The graph shows distance travelled by a car on a roller-coaster ride, at different times along its trip. It travels along the track, and then returns to its starting position. Study the graph and describe which point describes that THE CAR IS TRAVELLING ITS FASTEST.
Important Questions on Describing Motion
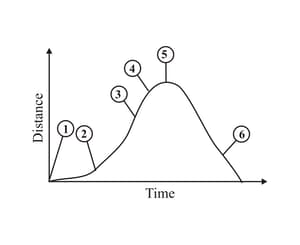
The graph shows distance travelled by a car on a roller-coaster ride, at different times along its trip. It travels along the track, and then returns to its starting position. Study the graph and describe which point describes that THE CAR IS SPEEDING UP.
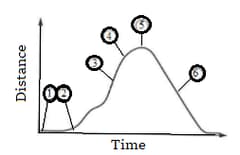
The graph shows distance travelled by a car on a roller-coaster ride, at different times along its trip. It travels along the track, and then returns to its starting position. Study the graph and describe which point describes that THE CAR IS SLOWING DOWN.
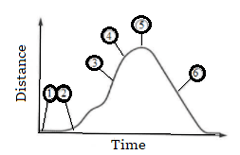
The graph shows distance travelled by a car on a roller-coaster ride, at different times along its trip. It travels along the track, and then returns to its starting position. Study the graph and describe which point describes that THE CAR STARTS ON ITS RETURN JOURNEY.
Scientists have measured the distance between the earth and the moon by reflecting a beam of laser light off the moon. They measure the time taken for the light to travel to the moon and back. How would the distance be calculated.
Complete the table showing information about the motion of a number of objects.
| Object | Distance Travelled | Time taken | Speed |
| Bus | |||
| Taxi | |||
| Aircraft | |||
| Snail |


