
The heights of the workers in a company is as follows.
Height (in )
Number of workers
Draw a histogram to represent the data.
Important Questions on Data Handling
Construct a histogram for the following data.
| Age (in years) | ||||||||
|---|---|---|---|---|---|---|---|---|
| Number of persons |
Draw a histogram to represent the following frequency distribution.
| Class intervals | ||||||
|---|---|---|---|---|---|---|
| Frequency |
Draw a histogram for the following data.
| Cost of living index | Total | ||||||||
|---|---|---|---|---|---|---|---|---|---|
| Number of months |
The following table gives the distribution of intelligence quotient (IQ) of pupils of class VIII in a school.
| IQ | |||||||
|---|---|---|---|---|---|---|---|
| Number of pupils |
Draw a histogram for the above data.
The given histogram depicts the marks obtained by students of a class:
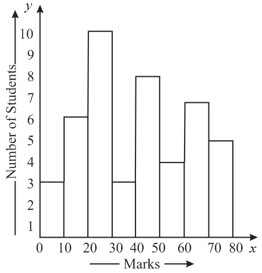
What is the class size?
The given histogram depicts the marks obtained by students of a class:

How many students obtained less than marks?
The given histogram depicts the marks obtained by students of a class:

How many students obtained or more marks but less than marks?
The given histogram depicts the marks obtained by students of a class:

What is the interval of highest marks and how many students are there in this interval?


