
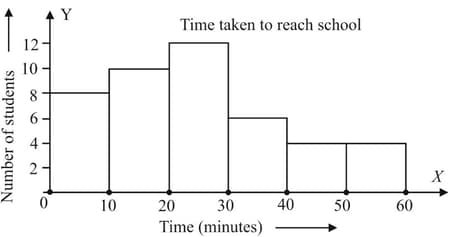
The histogram given below depicts the time taken by some students to reach school.
How many students take minutes or more to reach school?
Important Questions on Data Handling
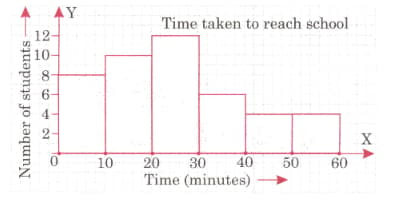
The histogram given alongside depict the time taken by some students to reach school.
How many students take minutes or more but less than minutes?
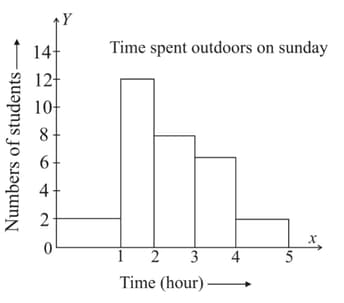
The histogram given alongside is based on the number of hours students spent outdoors on a Sunday.
What is the size of each class interval?
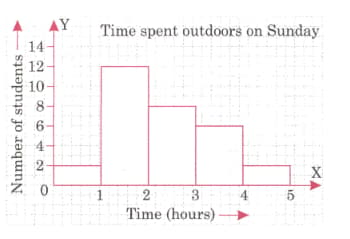
The histogram given alongside is based on the number of hours students spent outdoors on a Sunday.
How many students spent less than an hour outdoors?
Which interval of time were the largest number of students present outdoors?
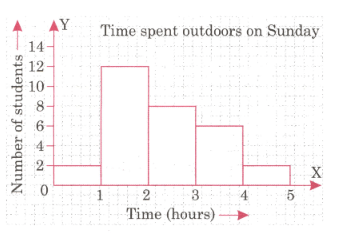
The histogram given alongside is based on the number of hours students spent outdoors on a Sunday. How many students spent more than four hours outdoors?
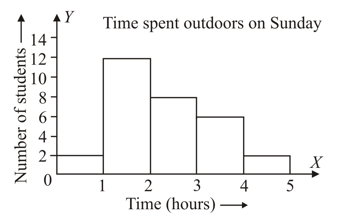
The histogram given alongside is based on the number of hours students spent outdoors on a Sunday.
How many students spent more than three hours outdoors?
Given below are the heights (in cm) of ninety children.Prepare a frequency table by grouping their heights into classes of cm, cm, cm, cm cm, cm.
Also represent the data by histogram.
The number of students in a hostel speaking different languages is given below:
| Language | English | Hindi | Punjabi | Bengali | Urdu |
| Number of students |
Display the above data in a pie chart.


