
The histogram shown represents the times taken, in minutes, for men to complete a task. Two men are selected at random from the group. Find the probability that the:

first man took less than minute, given that he took less than minutes
Important Questions on Probability
The histogram shown represents the times taken, in minutes, for men to complete a task. Two men are selected at random from the group. Find the probability that the:
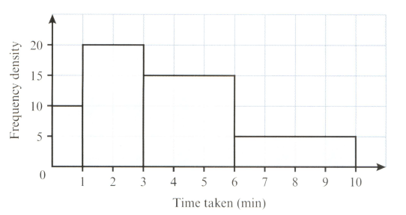
second man took less than minutes, given that the first man took less than minute.
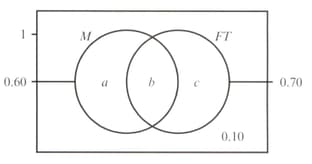
At an insurance company, of the staff are male and work full-time . The following Venn diagram shows this and one other piece of information.

What information is given by the value in the Venn diagram?
At an insurance company, of the staff are male and work full-time . The following Venn diagram shows this and one other piece of information.

Find the value of , and .
At an insurance company, of the staff are male and work full-time . The following Venn diagram shows this and one other piece of information.
An employee is randomly selected. Find:
At an insurance company, of the staff are male and work full-time . The following Venn diagram shows this and one other piece of information.

An employee is randomly selected. Find:
At an insurance company, of the staff are male and work full-time . The following Venn diagram shows this and one other piece of information.
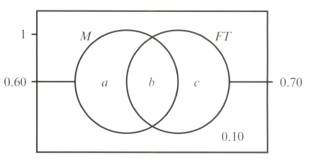
An employee is randomly selected. Find:
.


