
The histogram shows the lengths of a sample of European otters.
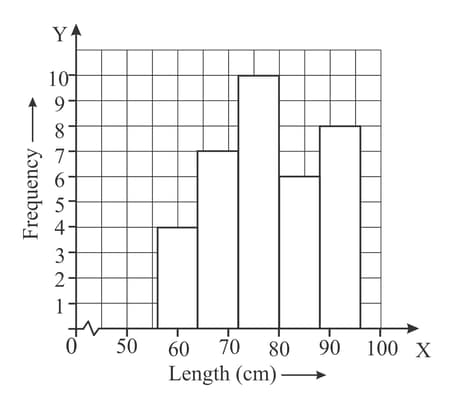
Find the class interval that contains the median.
Important Questions on City Skylines (Histograms)
The histogram shows the lengths of a sample of European otters.

Calculate an estimate for the mean length in .
The histogram shows the waiting times for some customers at a supermarket.

Frequency density value at interval is , is , is , is
State the modal class.
The histogram shows the waiting times for some customers at a supermarket.

Frequency density value at interval is , is , is , is
Calculate an estimate for the mean waiting time in seconds rounded off to two decimal places.
The histogram shows the waiting times for some customers at a supermarket.

Frequency density value at interval is , is , is , is
Find the total number of customers.
The histogram shows the waiting times for some customers at a supermarket.
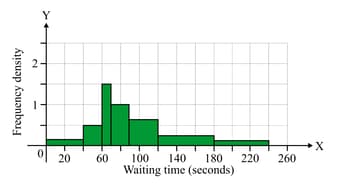
Frequency density value at interval is , is , is , is
Find an estimate for the number of customers who had to wait between and seconds, and also find who had to wait longer than minutes.


