
The histograms below illustrate the number of hours of sunshine during August in two regions, $A$ and $B$. Neither region had more than 8 hours of sunshine per day.
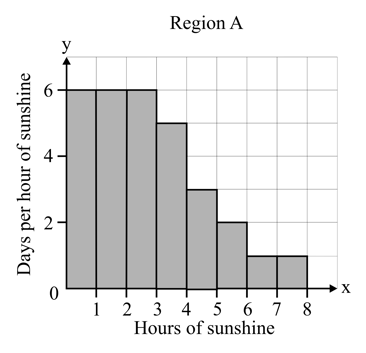
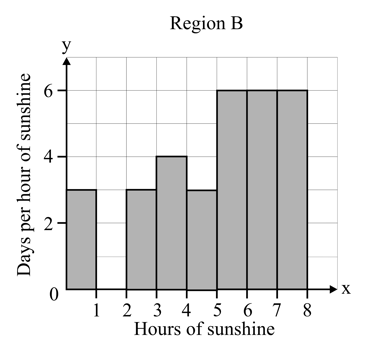
After studying the histograms, two students make the following statements.
- Bindu: There was more sunshine in region A than in region during the first weeks of August.
- Janet: In August there was less sunshine in region than in region .
Discuss these statements and decide whether or not you agree with each of them.In each case, explain your reasoning.
- Janet: In August there was less sunshine in region than in region .
Discuss these statements and decide whether or not you agree with each of them.In each case, explain your reasoning.
Important Questions on Representation of Data
A hotel has rooms. The table summarises information about the number of rooms occupied each day for a period of days.
| Number of rooms occupied | ||||||
| Frequency |
Draw a cumulative frequency graph on graph paper to illustrate this information.
A hotel has rooms. The table summarises information about the number of rooms occupied each day for a period of days.
| Number of rooms occupied | ||||||
| Frequency |
Draw a cumulative frequency graph on graph paper to illustrate this information.
Estimate the number of days when more than rooms were occupied.
A hotel has rooms. The table summarises information about the number of rooms occupied each day for a period of days.
| Number of rooms occupied | ||||||
| Frequency |
Draw a cumulative frequency graph on graph paper to illustrate this information.
On of the days at most rooms were occupied. Estimate the value of.


