
The marks obtained by examinees are shown by the frequency polygon. Given that mean marks is . Study the frequency polygon and answer the questions given below.
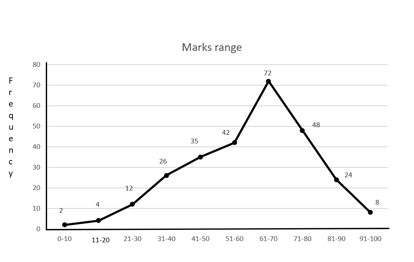
Percentage of the students who got marks above and below is -
Important Questions on Data Interpretation
Ratio of import and export of a company in different years

If import and export are increased by and respectively in , the resultant export became . What was the import in that year?
Ratio of import and export of a company in different years
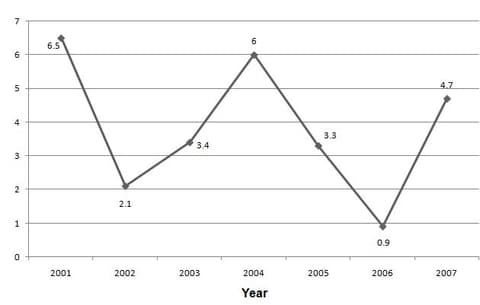
If the export is increased by in , the import becomes . What was export in that year?
Ratio of import and export of a company in different years

If the export was in , what will be the average export in all years together?
Read the following graph carefully and answer the questions given below.
Import by companies in different years (in )

The import of company A in is approximately what percent of import of company B in ?
Read the following graph carefully and answer the questions given below.
Import by companies in different years (in )
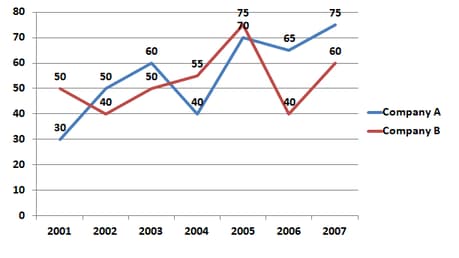
What is the total import of company B in all the years together? (in )
Study the pie chart given below and answer the question.
Monthly expenses of a family
Total Salary of a family
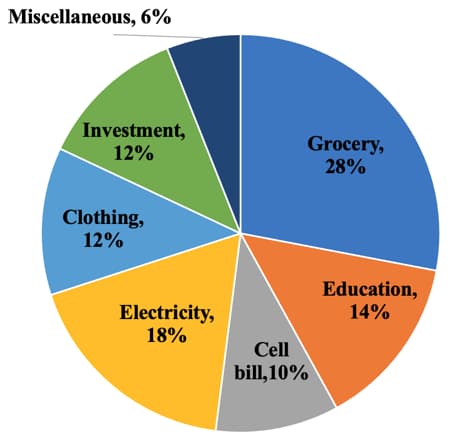
What are the total expenses spent by the family on clothing and grocery together?
The following Pie-chart shows the land distributions of a housing complex. If the total area of the complex is examine the pie chart and answer the question.
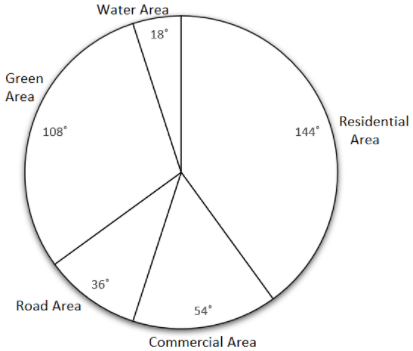
The percentage of the total area allotted for water area and green zone together is
The following Pie-chart shows the land distributions of a housing complex. If the total area of the complex is , examine the pie chart and answer the question.
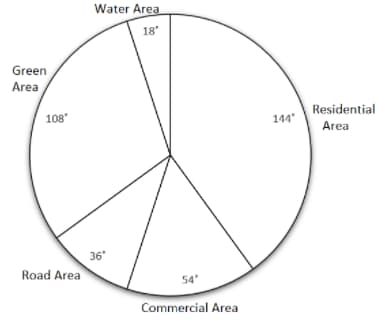
Land allotted for the green zone is greater than that for commercial purpose by _____.


