
The monthly budget of a family is given in the table on the left. This data has been presented in a pie chart on the right. The higher the share of expenditure of particular item of the total income, the more the area occupied by the item in the pie chart.
Budget head
Amount ()
Food
Education
Others
Savings
Total income
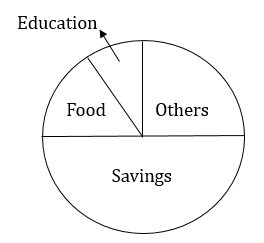
Looking at the pie chart answer the following question.
Say true or false: The largest part of the income is saved.
Important Questions on Data Handling
The monthly budget of a family is given in the table on the left. This data has been presented in a pie chart on the right. The higher the share of expenditure of particular item of the total income, the more the area occupied by the item in the pie chart.
| Budget head | Amount () |
| Food | |
| Education | |
| Others | |
| Savings | |
| Total income |

Looking at the pie chart answer the following question.
Say true or false: The Least amount of money is spent on education.
Draw a bar graph for the following data. Population of India in successive census years:
| Year | |||||||
| Population (in millions) (approx) |
Source: Data from census of lndia and .
Draw a pie chart for the following data.
| Item of expenditure | Food | Health | Clothing | Education | Savings |
| Amount spent in rupees |
Draw a double bar graph for the following data. Birth and Death rates of different states in .
| State | Birth Rate (Per ) | Death Rate (Per ) |
| Andhra Pradesh | ||
| Karnataka | ||
| Tamil Nadu | ||
| Kerala | ||
| Maharashtra | ||
| Orissa |
Source: The table is taken from vital statistics SRS .
Draw a Pie chart for the following data. Time spent by a child during a day:
| Time spent for | Sleep | School | Play | Others |
| Time spent | hours | hours | hours | hours |
The adjoining pie chart gives the expenditure on various items during a month for a family. (The numbers written around the pie chart tell us the angles made by each sector at the centre.)

Answer the following: On which item is the expenditure minimum?
The adjoining pie chart gives the expenditure on various items during a month for a family. (The numbers written in the pie chart tell us the angles made by each sector at the centre.)
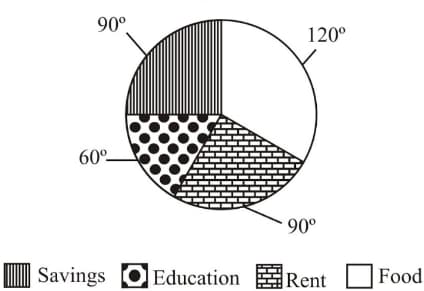
Answer the following: On which item is the expenditure maximum?
The adjoining pie chart gives the expenditure on various items during a month for a family. (The numbers written in the pie chart tell us the angles made by each sector at the centre.)

Answer the following: If the monthly income of the family is , what is the expenditure on rent?


