
EASY
6th CBSE
IMPORTANT
Earn 100
The number of tourists visiting Manali from May to September is shown below. Represent this information in the form of pictograph.
Month
May
June
July
August
September
No. of
16,000
16,500
10,000
7500
2500
Important Questions on Data Handling
EASY
6th CBSE
IMPORTANT
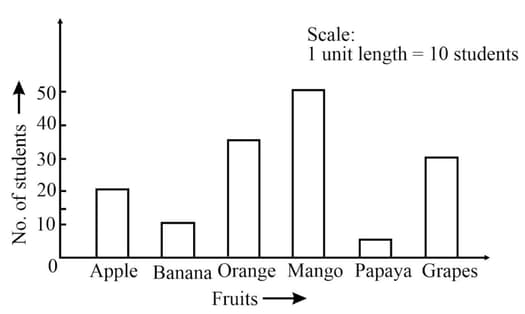
How many children like orange
MEDIUM
6th CBSE
IMPORTANT
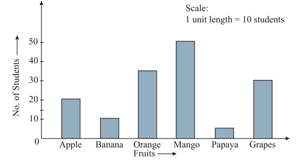
Which is the most favourite fruit among the children?
EASY
6th CBSE
IMPORTANT
The bar graph, given below, shows the choice of fruits of students of a school.
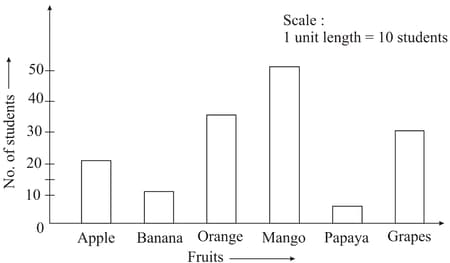
How many more children like grapes than apple?
MEDIUM
6th CBSE
IMPORTANT
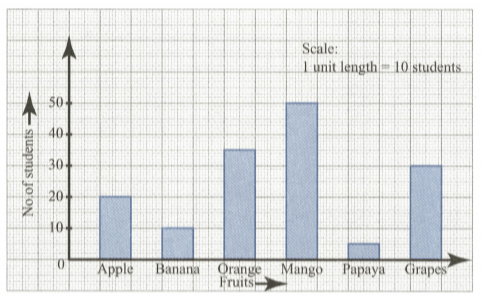
Arrange the fruits in the order in which they are liked by children with least liked written first.
EASY
6th CBSE
IMPORTANT
The given bar graph shows Mrs Basu’s monthly expenditure.
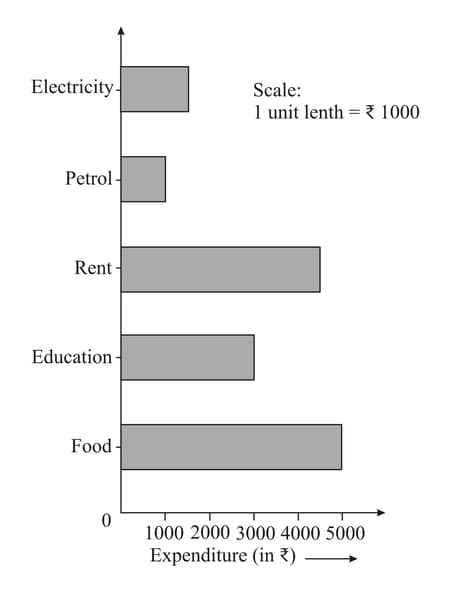
If Mrs Basu’s total monthly expenditure is , then find the value of .
EASY
6th CBSE
IMPORTANT
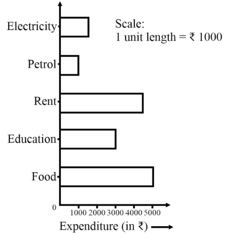
What part of the total expenditure does she spend on food?
EASY
6th CBSE
IMPORTANT
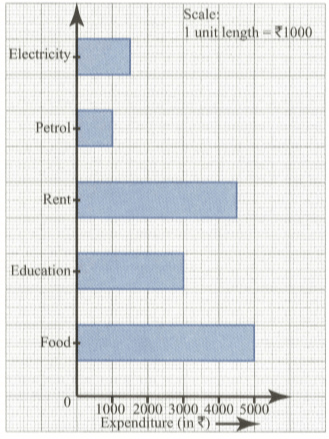
Find the ratio of her expenditure on electricity to that on rent.
EASY
6th CBSE
IMPORTANT
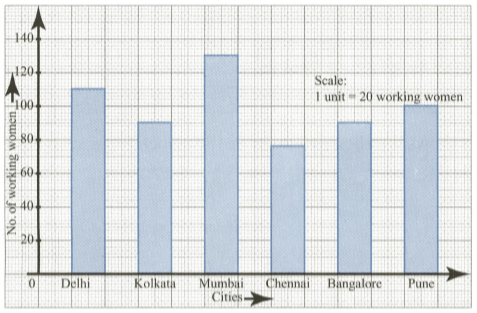
How cities have the same number of working women?


