
MEDIUM
8th CBSE
IMPORTANT
Earn 100
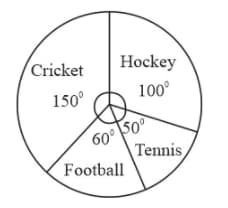
The pie chart (as shown) represents the amount spent on different sports by a sports club in a year. If the total money spent by the club on sports is , then find the amount spent on each sport.
Important Questions on Data Handling
MEDIUM
8th CBSE
IMPORTANT
Represent the following data with help of a pie diagram.
| Items | Wheat | Rice | Tea |
| Production(in metric tonnes) |
MEDIUM
8th CBSE
IMPORTANT
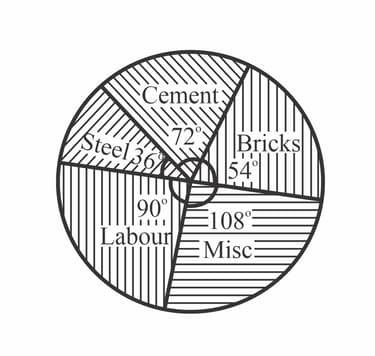
If the pie chart for a construction of a house in a city is given below. Then find the percentage of each item used.
HARD
8th CBSE
IMPORTANT
A marketing company conducted a survey among persons in Kanpur:
| Students | Professionals | Government servants | Businessman | Housewife |
Then draw a pie chart and determine the number of persons which are professionals
MEDIUM
8th CBSE
IMPORTANT
MEDIUM
8th CBSE
IMPORTANT
MEDIUM
8th CBSE
IMPORTANT
MEDIUM
8th CBSE
IMPORTANT
MEDIUM
8th CBSE
IMPORTANT


