The pie chart below shows the various occupations of people in a panchayath.
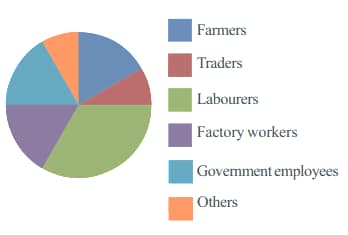
Roughly, how many times the number of farmers is the number of labourers?
Important Questions on Pie Charts
The pie chart below shows the various occupations of people in a panchayath.

Roughly what fraction of the total is the number of factory workers?
The pie chart below shows the various occupations of people in a panchayath.

Arrange the occupations in the order of the number of people in each.
Arrange in descending order.
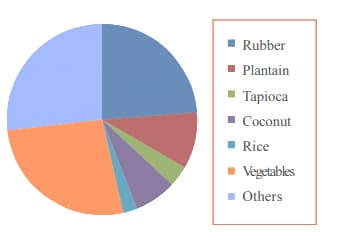
The pie chart below shows how the total farmland in a Panchayat is used for various crops.

Based on this figure, answer the following questions:
For which is the least land used?
The pie chart below shows how the total farmland in a Panchayat is used for various crops.
Based on this figure, answer the following questions:
For which is the most land used?
The pie chart below shows how the total farmland in a Panchayat is used for various crops.

Based on this figure, answer the following questions:
Roughly, what fraction of the total land is used for vegetables?
Given below is the pie-chart showing how Aravind, a class student spends his time:

The circle is divided into parts, each part indicating one hour.
What each colour shows is given below.
 School
 Sleep
Sleep
 Studies
 Play/exercise
 Others
Draw a bar graph showing these details.
There are books in the school library, classified as shown below.
Short story
Poetry
Novel
Science
Biography
Draw a pie chart showing this.
In a survey, the number of students who like different kinds of books were found as follows.
Short story
Poetry
Novel
Science
Biography
Draw a pie chart of this also.
Compare the two pie-charts.
Are books bought according to the preference of the students?
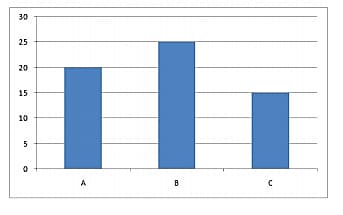
The bar graph below shows the number of girls in the three divisions of class in a school.
Draw a pie chart of this.