
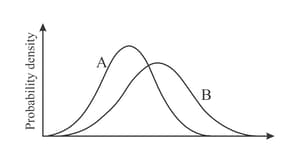
The probability distributions for and are represented in the diagram. Indicate whether each of the following statements is true or false.
Important Questions on The Normal Distribution
The probability distributions for and are represented in the diagram. Indicate whether each of the following statements is true or false.

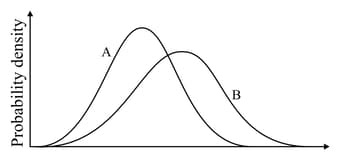
The probability distributions for and are represented in the diagram. Indicate whether each of the following statements is true or false.

and have the same range of values.
The probability distributions for and are represented in the diagram. Indicate whether each of the following statements is true or false.

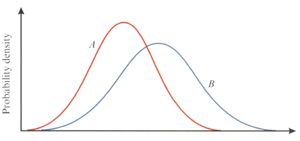
The probability distributions for and are represented in the diagram. Indicate whether each of the following statements is true or false.
At least half of the values in are greater than
The probability distributions for and are represented in the diagram. Indicate whether each of the following statements is true or false.
The diagram shows normal curves for the probability distributions of and that each contain values. Write down a statement comparing:
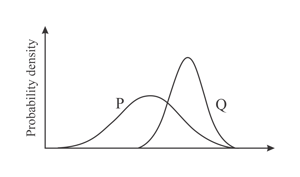
and
The diagram shows normal curves for the probability distributions of and that each contain values. Write down a statement comparing:
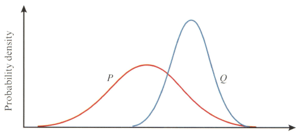
the median value for and the median value for
The diagram shows normal curves for the probability distributions of and that each contain values. Write down a statement comparing:

the interquartile range for and the interquartile range for


