The shoppers who come to a departmental store are marked as: man(M), woman (W), boy (B) or girl (G). The following list gives the shoppers who came in the first hour in the morning:
W W W G B W W M G G M M W W W W G B M W B G G M W W M M W W W M W B W G M W W W W G W M M W W M W G W M G W M M B G G W
Make a frequency distribution table using tally marks. Draw a bar graph to illustrate it.
Important Questions on Data Handling
Draw a histogram using the frequency table of the following data and answer the following question.
The weekly wages (in ) of workers in a factory are.
How many workers earn and more?
Draw a histogram for the following data and answer the following question.
The weekly wages (in ) of workers in a factory are.
How many workers earn less than ?
The number of hours for which students of a particular class watched television during holidays is shown through the given graph.
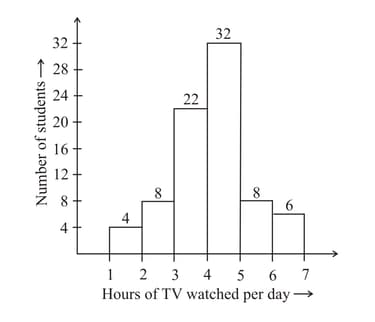
If the maximum number of students watch the TV for , then find the value of
The number of hours for which students of a particular class watched television during holidays is shown through the given graph.

How many students watched TV for less than hours?
The number of hours for which students of a particular class watched television during holidays is shown through the given graph.

How many students spent more than hours in watching TV?
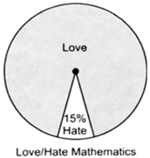
The following pie chart gives you the information about your class. Find the fraction of the circle representing each of the information.
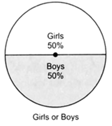
The following pie chart gives you the information about your class. Find the fraction of the circle representing each of the information.
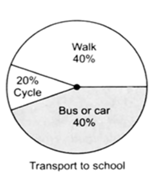
The following pie chart gives you the information about your class. Find the fraction of the circle representing each of the information.