
Two different finance companies declare a fixed annual rate of interest on the amount invested by investors with them. The interest rate declared by these companies can vary from year to year depending on the variation in the country's economy and the interest rate of the banks. The annual rate of interest offered by the two companies P and Q are shown in the graph below. Study the graph and answer the question. Annual percentage rate of interest offered by two finance companies P and Q over the years.
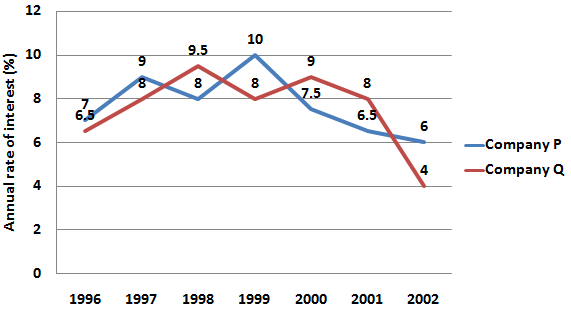
If two sums in the ratio are invested in companies P and Q respectively in , then what is the ratio of the simple interests received from companies P and Q respectively after ?
Important Questions on Data Interpretation
The pie-chart given here shows the country's expenditure on various sports during a particular year. Study the pie-chart and answer the question given below.
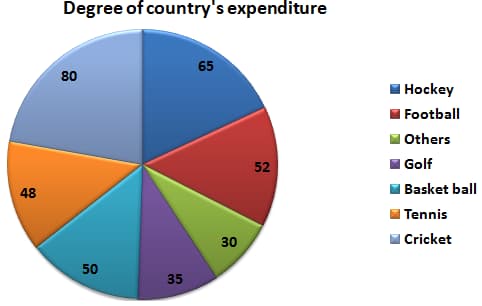
If the total amount spent on sports in the year was then the amount spent on cricket and football together was _____.
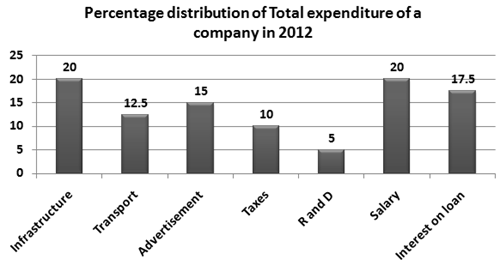
Study the graph and answer the question.
What is the ratio of the total expenditure on salary and interest on loans to the total expenditure on infrastructure and transport?
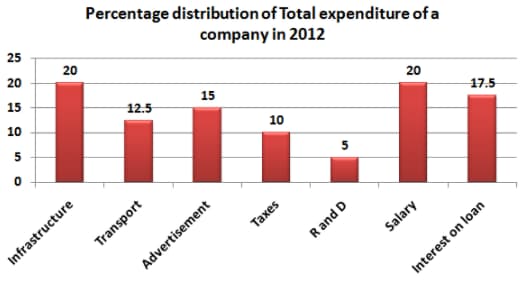
Study the graph and answer the question.
If the total amount of expenditure of the company is times the expenditure on transport, then the value of is _____.
The pie-chart given here shows the country's expenditure on various sports during a particular year. Study the pie-chart and answer the question given below.

If the total amount spent on sports in the year was , then the amount spent on tennis is more than the expenditure on golf by _____.
Directions: Study the given pie chart and answer the question that follows. Distribution of students studying in schools A, B, C, D and E. Total number of students is equal to .

The number of students in school E exceeds the total number of students in schools A and B by , where lies between:
Directions: Study the given pie chart and answer the question that follows. Distribution of students studying in schools A, B, C, D and E. Total number of students is equal to .

If the ratio of the number of boys to that of girls in school C is and that in school B is , then what is the ratio of the number of boys in school C to the number of girls in school B?
Directions: Study the given pie chart and answer the question that follows. Distribution of students studying in schools A, B, C, D and E. Total number of students is equal to .
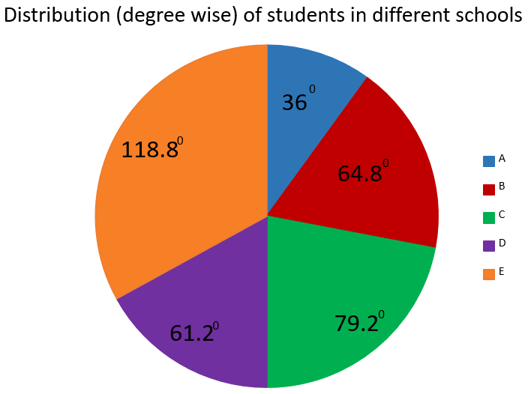
The total number of students in schools D and E is what percentage more than the total number of students in schools B and C?
The following line-graph gives the percent profit earned by two companies X and Y during the period . Study the line-graph and answer the questions that are based on it. Percentage profit earned by two companies X and Y over the given years:
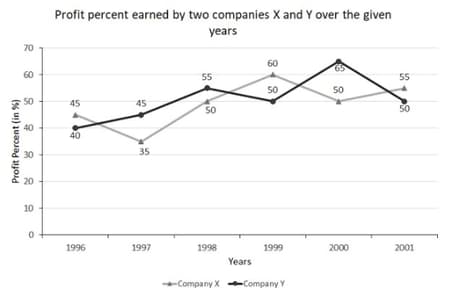
If the expenditure of company Y in was , what was its income in ?


