What happens to the graph when the value of the constant term changes?

Important Questions on Curved Graphs
Construct a table of values of for and plot the graph.
Complete this table of values and then plot the graph of
Construct a table of values of from and plot the graph.
Using values of from to , construct a table of values and plot the graph of
Using values of from to , construct a table of values and plot the graph of
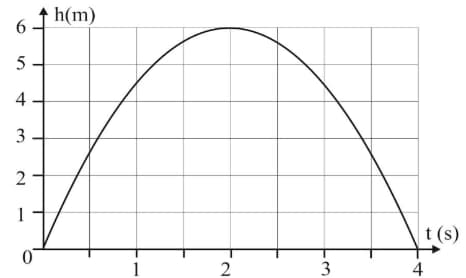
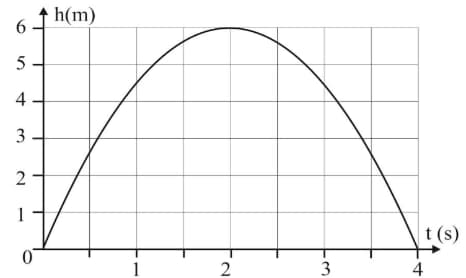
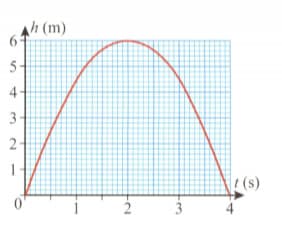
People who design water displays (often set to music) need to know how high water will rise from a jet and how long it will take to return to the pool. This graph shows the height of a water arc from a fountain (in metres) over a number of seconds. What was the greatest height (in metres) reached by the water arc.

People who design water displays (often set to music) need to know how high water will rise from a jet and how long it will take to return to the pool. This graph shows the height of a water arc from a fountain (in metres) over a number of seconds. How long (in seconds) did it take the water to reach the greatest height?
 .
.
People who design water displays (often set to music) need to know how high water will rise from a jet and how long it will take to return to the pool. This graph shows the height of a water arc from a fountain (in metres) over a number of seconds. For how long was the water arc above a height of .
 ..
..
