When you ride a Ferris wheel, your vertical height above the ground changes. The relationship between your height above the ground and the time for a complete revolution of the wheel can be modelled with a sinusoidal graph like this:
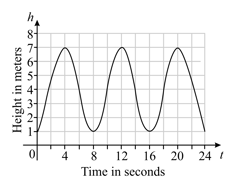
Determine how long it takes for one complete revolution of the wheel.
Important Questions on Like Gentle Ocean Waves (Sine and Cosine Functions)
When you ride a Ferris wheel, your vertical height above the ground changes. The relationship between your height above the ground and the time for a complete revolution of the wheel can be modelled with a sinusoidal graph like this:
The Ferris wheel is circular. Its radius is , find the value of
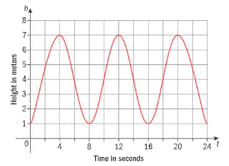
When you ride a Ferris wheel, your vertical height above the ground changes. The relationship between your height above the ground and the time for a complete revolution of the wheel can be modelled with a sinusoidal graph like this:

Find a function that models this graph.
The height in meters of the tide above the mean sea level one day at Bal Harbor can be modelled by the function , where is the number of hours after midnight.
Find when and hours.
The height in meters of the tide above the mean sea level one day at Bal Harbor can be modelled by the function , where is the number of hours after midnight. The height of the tide at clock in the afternoon is . Find the value of .
The height in meters of the tide above the mean sea level one day at Bal Harbor can be modelled by the function , where is the number of hours after midnight.
A ship can cross the harbour if the tide is at least above the average sea level. Determine the times when it can cross the harbour.
One day, high tide in Venice, Italy was at midnight. The water level at high tide was , and later at low tide the water level was . Assume that the next high tide is hours later and that the height of the water level can be modelled with a sinusoidal function.
Draw a graph of your function.
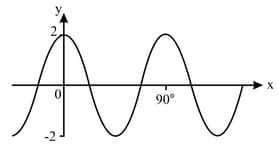
For the following graph, find the amplitude, frequency and period. Then, write down the equation that represents the function.
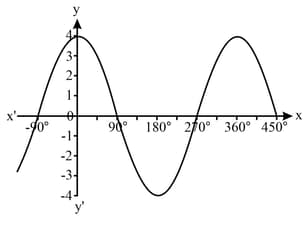
For the following graph, find the amplitude, frequency and period. Then, write down the equation that represents the function.