Pie Charts
Pie Charts: Overview
This topic covers concepts such as Structure of Pie Chart, Division of Circles in Segments to Represent Data, Pie Charts with Data in Terms of Number, Pie Charts with Data in Terms of Fraction, Pie Charts with Data in Terms of Percentage, etc.
Important Questions on Pie Charts
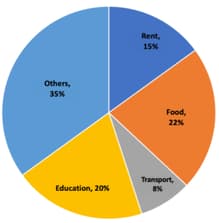
Study the following Pie-Chart carefully to answer these questions.
Total students
Percentage distribution of students in a different courses.
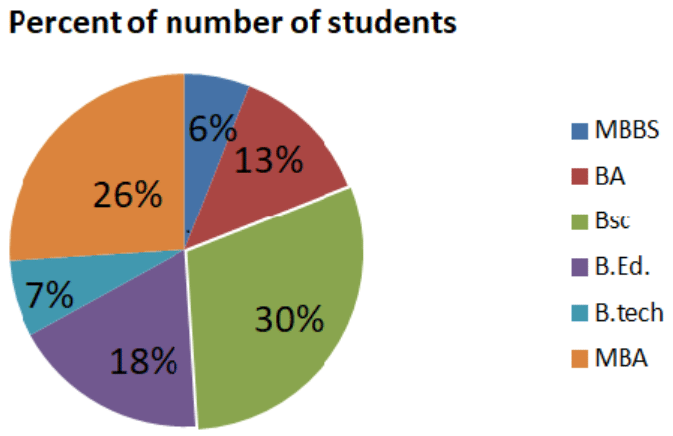
What is the total number of students B.Ed, B.A., and MBBS together?
The pie chart given here shows various expenses of a publisher in the production and sale of a book. Study the chart and answer these questions based on it.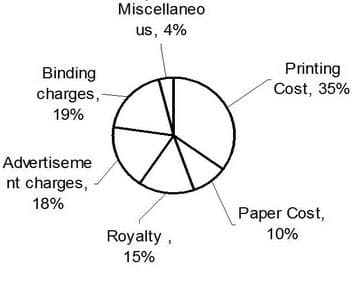
What is the total number of candidate qualified from state 'A' and 'B' together ?
Study the information carefully to answer the questions that follow.
The following pie chart represents the break-up of Raju's monthly Expenses.
As prices dropped, Raju's expenditure on clothes dropped by . As a result of this, his expenditure on 'others' decreased from to .What percentage of his expenditure on 'others' was spent on clothes?
Using the given pie-chart answer the following.
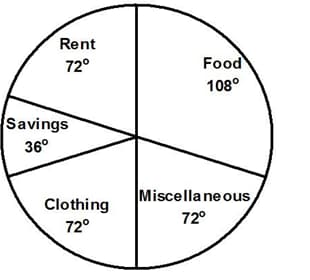
If the annual income of the family is , then the savings is ?
The above pie charts given the sales of scooters by different companies for , and .
Scooter sales in , and is , and respectively.
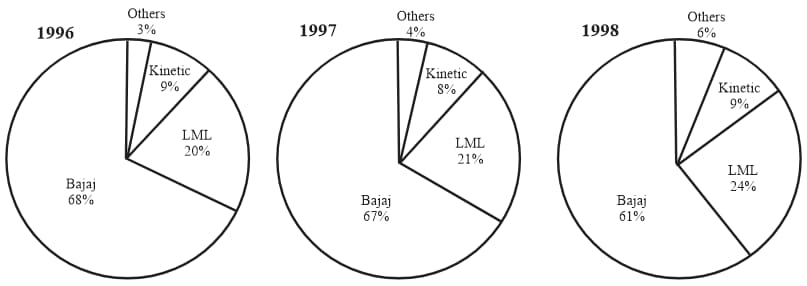
The total number of Scooters sold by LML in the three years is
The pie chart given below shows the expenditure incurred in bringing out a book, by a publisher.
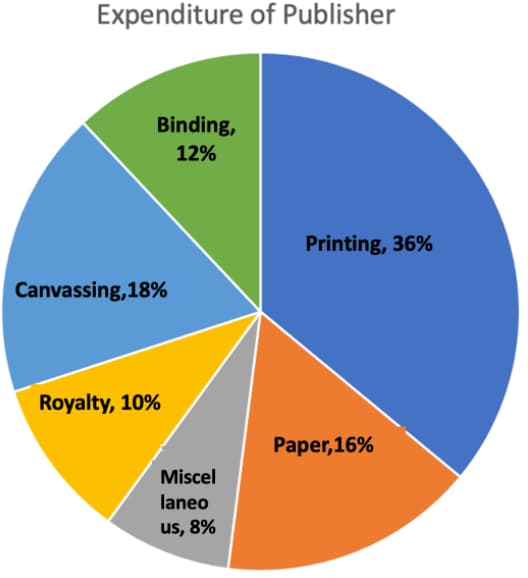
Study the graph and answer the questions given below:
If are published and miscellaneous expenditures amount to and the marked price is above cost price, then the marked price of each copy is:
Distribution of candidates who were enrolled for MBA entrance exam and the candidates (out of those enrolled) who passed the exam in different institutes: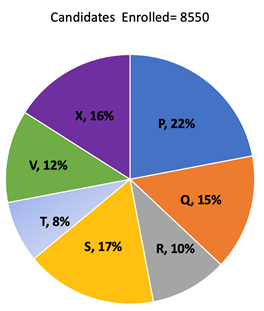
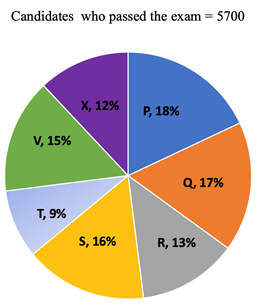
Which institute has the highest percentage of candidates passed to the candidates enrolled?
The following pie charts shows the percentage of students in each faculty at North-West university and the number of non-US student in the Art faculty.There are a total of 1050 students in the Arts faculty. Study the pie chart and answer the question.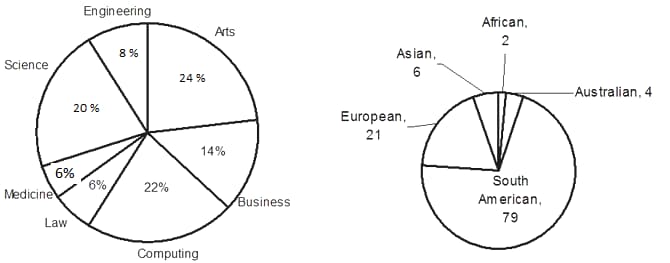
What percentage of students in the Arts faculty are Non-US students?
The annual agricultural production (in tonnes) of an Indian State is given in the pie chart. The total production is tonnes. Read the pie chart and answer question
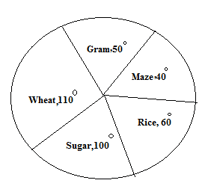
What is the annual production of wheat
The following pie-chart shows the sources of funds to be collected by the National Highways Authority of India (NHAI) for its Phase II projects. Study the pie-chart and answer the questions that follow.
SOURCE OF FUND TO BE ARRANGED BY NHAI FOR PHASE II PROJECTS
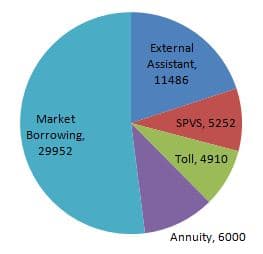
Total funds to be arranged for Projects (Phase II)
Near about of the funds are to be arranged through _____.
Directions Study the following graphs carefully and answer the questions that follow:
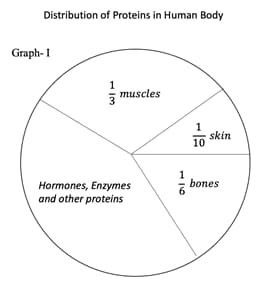
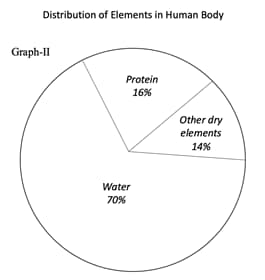
What part of the human body is made of neither bones nor skin?
Directions : Study the following pie-charts carefully and answer the questions given below:
Discipline-wise Breakup of the Number of candidates apprised in Interview and Discipline-wise Breakup of the Number of candidates selected by an organization
Discipline-wise Breakup of Number of candidates appeared in Interview
Total Number of Candidates Appeared In the
Interview = 25780
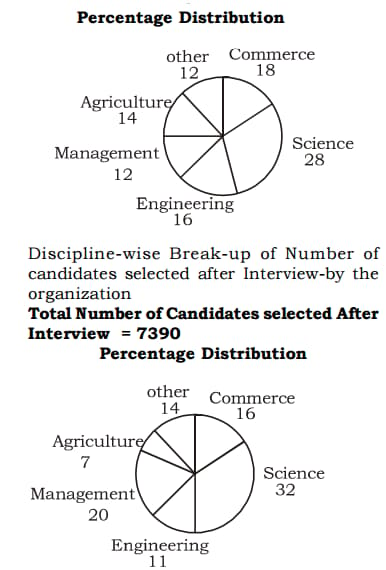
What was the ratio of the number of candidates appeared in interview from other disciplines and the number of candidates selected from Engineering discipline respectively?
These questions are based on the following graphs :
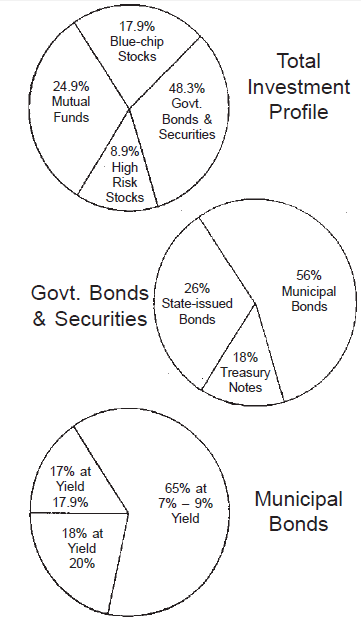
Total Investment Funds
Which of the following was the greatest?
Read the following pie-chart carefully and answer the questions given below.
Degree wise distribution of expenditure by a country on different sports in .
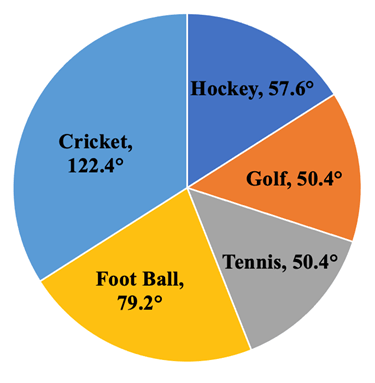
The expenditure on football was what percent of total expenditure?
Study the following pie chart carefully to answer these questions.
The following pie chart gives the expenditure of funds by the university for various purposes.
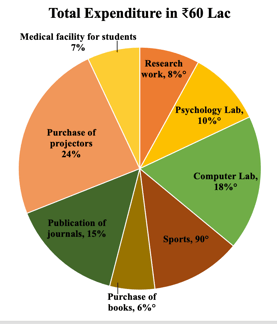
If the expenditure on the purchase of overhead projectors for Ph.D. students is decreased by , then what will be the expenditure on the same after the decrease?
Directions:The distribution of production of 'Beautiful Gardens' orchards is given for the year and , Assuming that the total production has not changed in these years, answer the following questions :
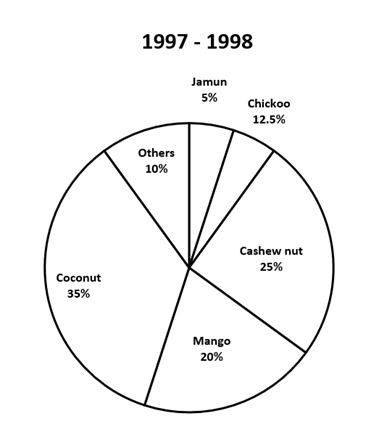
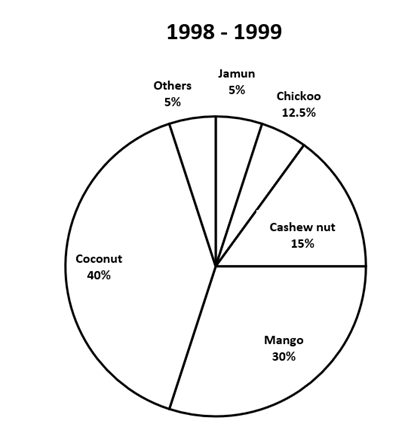
What is the growth of coconut from to ?
A Savings bank in a large city published the following graph depicting amount of assets of one year in their monthly magazine: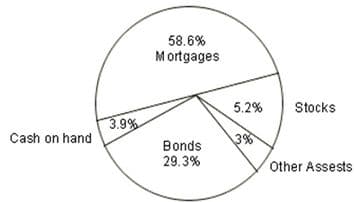
What is the ratio of sum of assets of mortgages and other assets to that of cash on hand, bonds and stocks (keeping the percentages to the nearest integers)
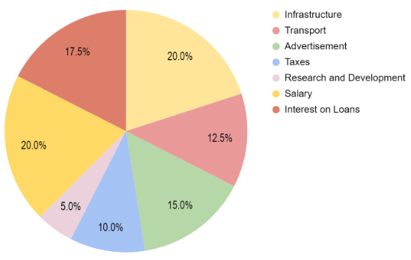
Study the pie-chart below and answer the questions.
Percentage distribution of total expenditure of a company.
What is the ratio of total expenditure on Infrastructure and Transport to the total expenditure on Taxes and Interest on Loans?
Direction (96-100): The following table gives expenditure details of a family during the years 2005 to 2009. Study the table and answer the questions.
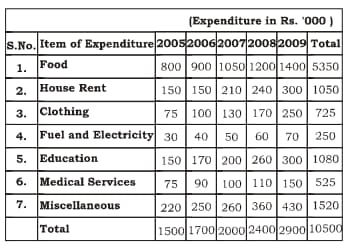
What is the percent increase in expenditure on Education during to ?
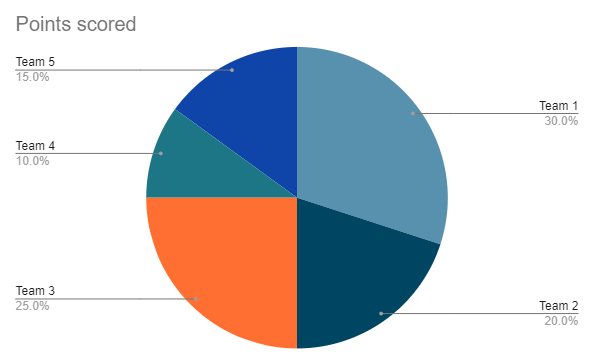
Points scored by each team as a percentage of total points scored by all the team. What will be the central angle of Team in round if they score twice the points while all others score the same points as they scored in last round?
