
Chart Logic
Chart Logic: Overview
This topic covers concepts, such as, Pie Chart, Line Graph, Bar Graphs, Mixed Graphs of Line and Bar Charts, Structure of Radar Chart & Data Interpretation etc.
Important Questions on Chart Logic
The pie chart given here shows various expenses of a publisher in the production and sale of a book. Study the chart and answer these questions based on it.
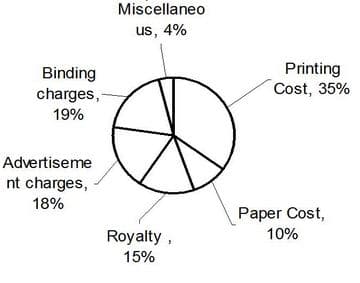
What is the number of candidates qualified from state E?
Following bar graph shows the ratio of export to import of two companies A and B during the period of 1990-1995.
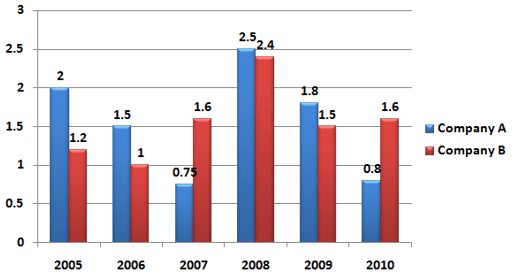
In which year, the difference of export and import for Company B is minimum?
Study the pie-chart carefully to answer the following questions.
Cost estimated by a family in renovation of their house.
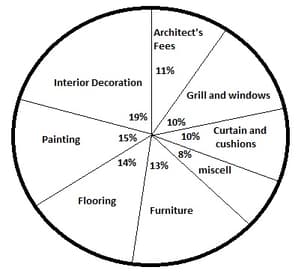
Total estimated cost is
Other than getting the discount of on the estimated cost of furniture and the actual miscellaneous expenditure being instead of the estimated one, the family's estimated cost is correct. What is the total amount spent by the family in renovating the house?
Study the following graph carefully and answer the question given below:
The following line graph gives the number of Students Studying in Different Universities in a year,
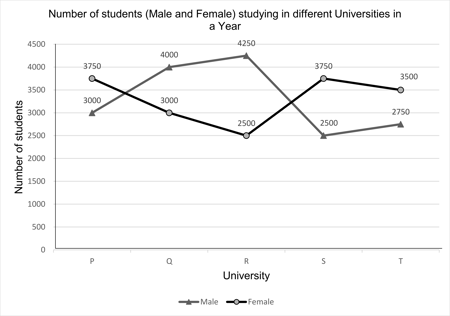
What is the average number of females in all the Universities together?
Read the following pie-chart carefully and answer the question given below.
The number of female candidates passed
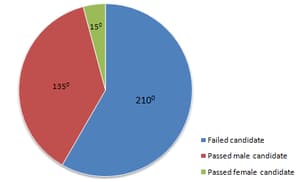
The percentage of passed female candidates with respect to total examinees is:
Study the following graph carefully ---
Production of three different type of tyres by a company over the year (in Lakhs)
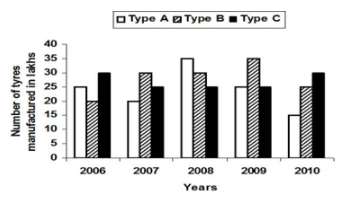
In and , what was the difference between the number of B-type tyres manufactured ?
The following line graph gives the percent profit earned by two companies and during the period to
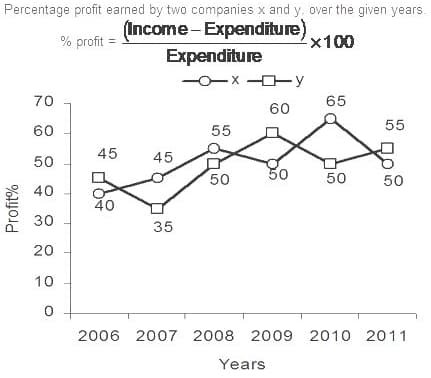
If the expenditure of company in was what was its income in
Study the chart and answer the question below:
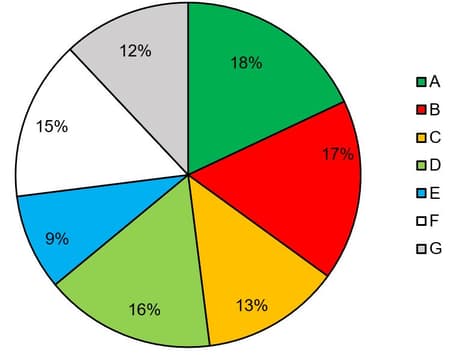
The following pie chart shows the collection of revenue of the Govt. of India in different departments.
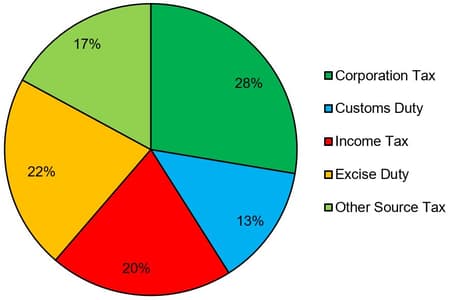
What is the total revenue from excise and corporation tax earned by Govt. of India, if the total revenue collected by Govt. of India is ?
Read the following pie chart carefully and answer the question given below.
Number of cars of different models produced by a company in and :
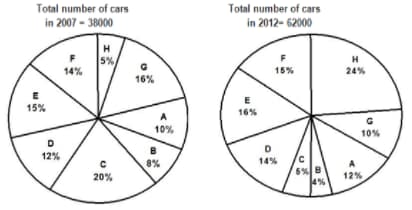
What is the approximate percentage increase in the number of cars of F model from to ?
Study the following line graph and answer the questions based on it.
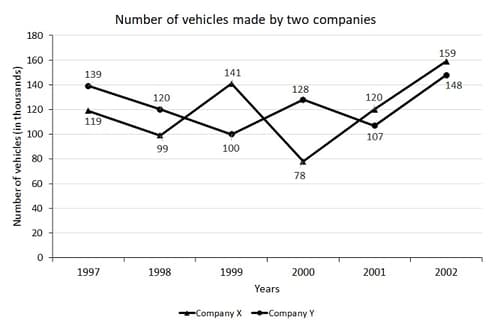
What is the difference between the numbers of vehicles manufactured by Company Y in and ?
Answer the given question based on the following data:
The below graph represents the Export of Cashew nuts in Quantity and Values from the USA during .
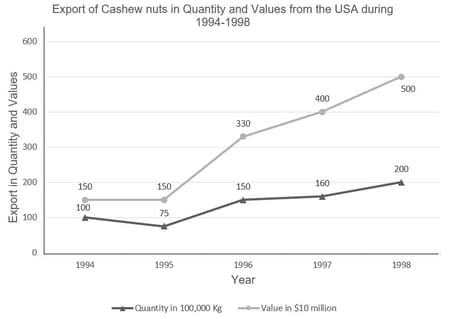
If the quantity of exports in was more than the average export for the given period, what was the volume exported in ?
Study the data presented in the following graph to answer these questions.
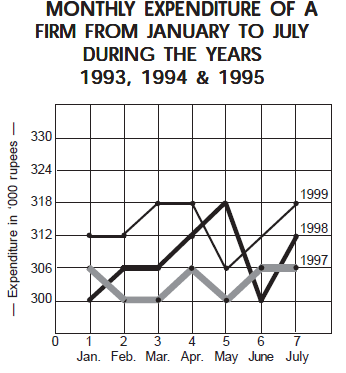
What is the total expenditure during the period under review ?
Study the following information to answer the given questions.

Percentage of girls in different courses
Total students
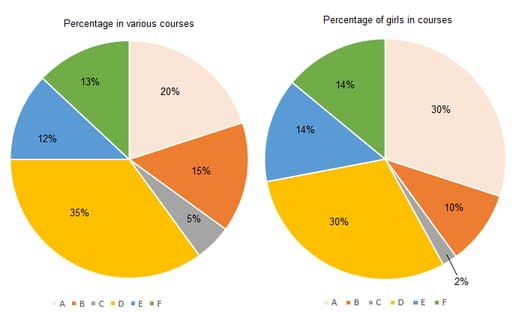
For which course is the number of boys the minimum?
Directions: Study the Pie-charts below to answer the following question.
The below pie-charts shows the distribution of candidates who joined M.B.A. programme and successfully completed it.
The below pie chart shows the number of candidates who join MBA,

The number of candidates who join MBA
The below pie chart shows the number of candidates who completed MBA,
The number of candidates who completed MBA
The number of candidates who completed the M.B.A. programme from A and D Institutes together exceeds the number of candidates who joined Institutes C and E together by-
Directions— Study the following graph carefully to answer the questions— The following Bar graph gives the number of products manufactured and sold by a company over the years. to Value in
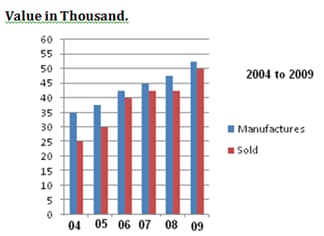
The number of products sold by the company in the year is what per cent of the number of products manufactured by it in that year ? (Rounded off to two digits after decimal)
Read the following graph and answer the questions given below-
The following graph shows the balance of three persons Uday, Vijay and Lokendra in a branch of IOB for theundefined of the year.
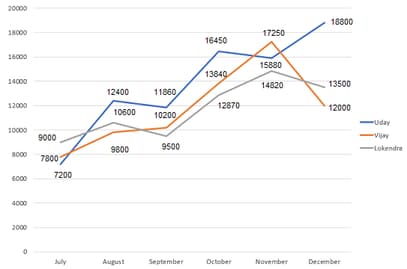
Balance of Lokendra in first three months is approximate what percent of the balance of last three months salary?
Read the following graph carefully and answer the questions given below :
Marks obtained by five students in different languages
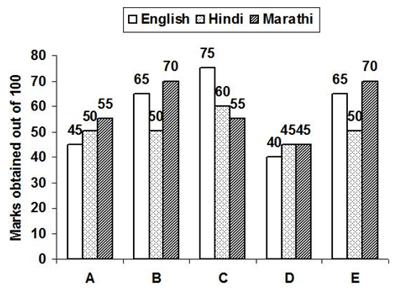
What is the respective ratio between the marks obtained by all students in Hindi and Marathi ?
Read the following graph carefully and answer the questions given below. Percentage profit of two companies in different years:
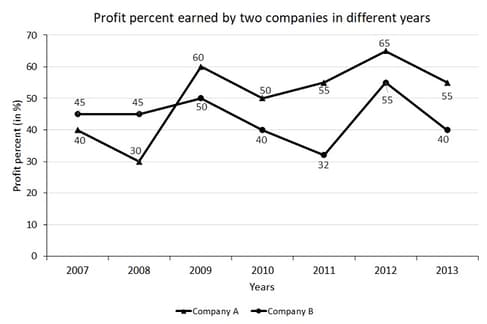
If total income of company B in was , then what was the total expenditure of that company in the same year?
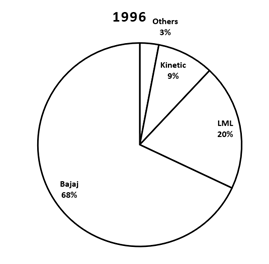
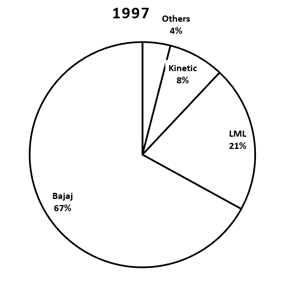
The above pie charts given the sales of scooters by different companies for
Scooter sales in
Scooter sales in
Sales in
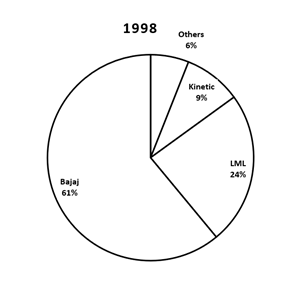
Assuming the scooter market grows by for the next two years and the market share of LML, kinetics and others remain the constant, then the market share of Bajaj in shall be ________.
Study the following pie-chart carefully to answer the question.
Total expenditure is .
The following pie-chart gives the expenditure of funds by the university for various purposes:
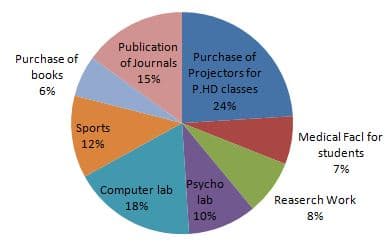
What is the difference between the expenditure made by the university for Publication of Journals and Psychology Laboratory?


