
Venn Diagrams
Venn Diagrams: Overview
This topic covers concepts, such as, Representation of Sets: Venn Diagram, Venn Diagram Presentation of Union of Two Sets, Venn Diagram Presentation of Symmetric Difference of Sets & Venn Diagram Presentation of Complement of a Set etc.
Important Questions on Venn Diagrams
In a group of people, of them like to read Indian Express, of them like to read Financial Express. If of people do not like to read at all, then how many people like to read both i.e. Indian Express and Financial Express.
In a group of tourists, visited only Kolkata and visited only Mumbai. How many visited both the places?
In a group of tourists, visited only Kolkata and visited only Mumbai. How many visited Kolkata?
In a group of persons who speak English or Tamil or both, speak English and speak Tamil. How many speak only Tamil?
In a class of students, play hockey and play cricket. _____ plays both the games ?
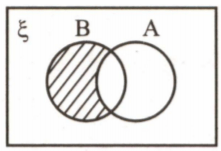
The set represented by the shaded region in the Venn-diagram is .
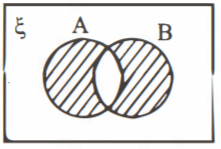
The set represented by the shaded region in the Venn-diagram is . _____
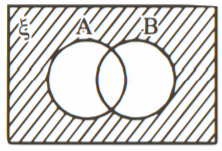
_____ is the set represented by the shaded region in the Venn-diagram:
In a group of girls, like cashew nuts, like groundnuts and do not like both nuts. The number of girls like only cashew nuts are _____.
In a group of persons who speak English or Tamil or both, speak English and speak Tamil. How many speak both the languages?
In a group of persons who speak English or Tamil or both, speak English and speak Tamil. How many speak only English?
In a city, people read newspaper read newspaper , and read neither nor . Percentage of people read both the newspapers as well as is . Now, find the value of .
Given {students who like cricket} and {students who like tennis}; and . Illustrate this through a Venn diagram and then find .
In a town of persons, persons read Hindi, read English and read both. Then the number of person who read neither is
In a class of students who appeared certain examinations, students failed in CET, in NEET, in JEE, failed in CET and NEET, in NEET and JEE, in CET and JEE and failed in all the three examinations. Find how many students did not fail in any examination.
For two events A and B, the probability that both the events occur simultaneously is equal to and the probability that none of the events occur is . Then, the probability that exactly one of A or B occurs is equal to
If and . Then, the correct representation of in the Venn diagram will be:


