
Reading Graphs
Reading Graphs: Overview
This topic covers concepts such as Understanding Line Graphs, Multiple Line Graph and Comparison Using Multiple Line Graphs.
Important Questions on Reading Graphs
The following line graph shows the total number of animals in a zoo
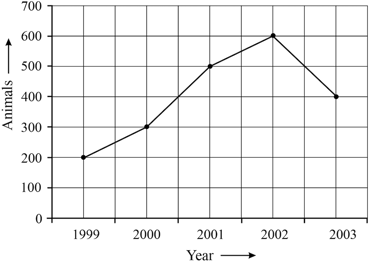
a) In which year did the zoo have the largest number of animals?
b) What is the percentage increase of animals in the zoo from to
Study the following line graph and answer the question.
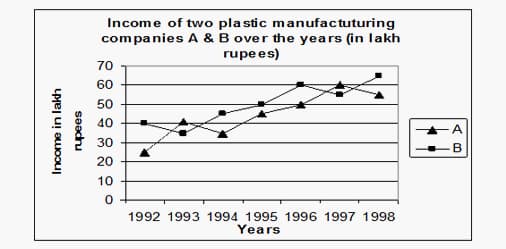
The average income of company per year is what percentage of the average income of company per year?(approximately)
Study the following line graph and answer the question.

Out of the total number of projects handled by Company in and together, were governmental projects. What was the total number of governmental projects handled by Company in and together?
Study the following line graph and answer the question.
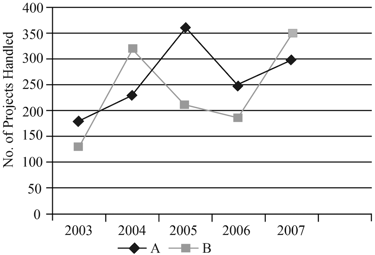
What is the difference between the total number of projects handled by company in and together and the total number of projects handled by Company in and together?
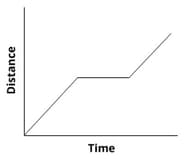
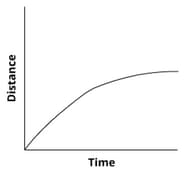
A courier-person cycles from a town to a neighbouring suburban area to deliver a parcel to a merchant. His distance from the town at different times is shown by the following graph.
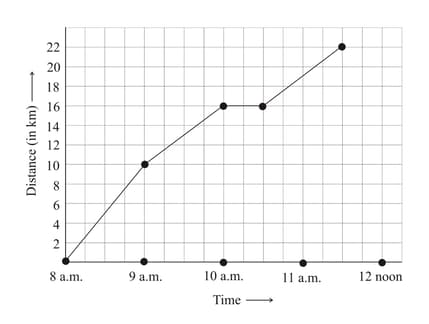
If the distance of the place of merchant from the town is , write as the final answer.
The line graph in the figure below shows the academic performance of two students during a year. Read the graph and find the following.
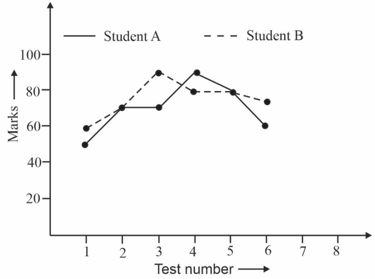
What is the difference between the least marks scored by student and student ? Write the numerical value of marks as the final answer.
A fisherman catches fish for minutes. He takes another half an hour to remove all the fish from the net and arrange them in a box.
The graph represents the number of fish caught in a day. Study the graph and answer the following question
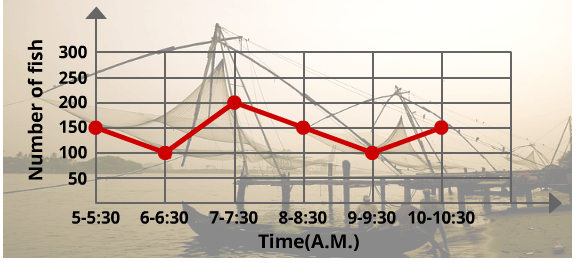
Total number of fish caught by the fisherman in the day = _____
A fisherman catches fish every half hour. He takes another half an hour to remove all the fish from the net and arrange them in a box.
The graph represents the number of fish caught in a day. Study the graph and answer the following question
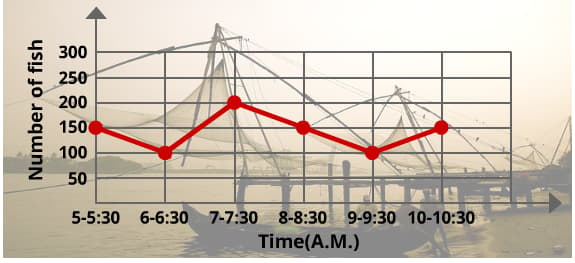
Number of fish caught between and _____.
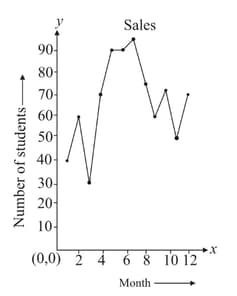
The graph represents yearly sales of a manufacturing company. Study the graph and choose the correct option.
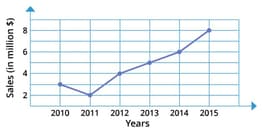
How much was the sale in the year 2013?
Use the simple interest graph and find the total amount Ram paid back if he took a loan of ₹ 10,000 for 8 years.
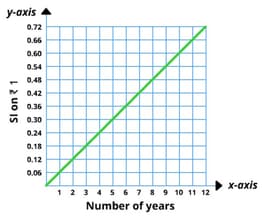
Total Amount Ram paid back = ₹ _____
Use the graph and find the simple interest on ₹ 1000 for 6 years
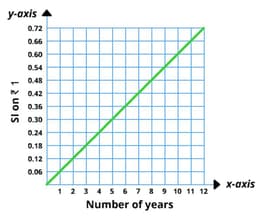
Interest = ₹ _____
The graph shows the speed of the car at different timings over a period of time. Please identify the situation that they represent
The graph shows the speed of the car at different timings over a period of time. Please identify the situation that they represent
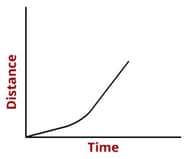
The graph shows the speed of the car at different timings over a period of time. Please identify the situation that they represent
The given graph represents the total runs scored by two batsmen during ten different matches in . Study the graph and answer the following questions.
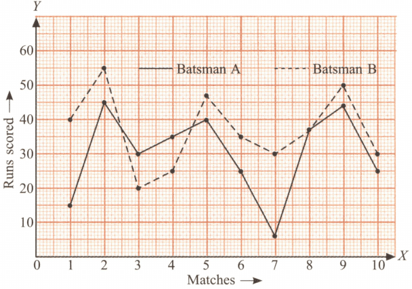
Whose average performance is better?
The given graph represents the total runs scored by two batsmen during ten different matches in . Study the graph and answer the following questions.
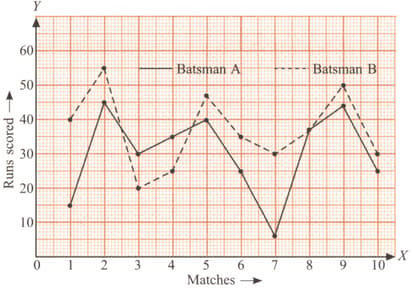
In which test did batsman score the least number of runs?
The given graph represents the total runs scored by two batsmen during ten different matches in . Study the graph and answer the following questions.

In which match did the two batsmen score equal number of runs?
The following graph shows the temperature of a patient in a hospital, recorded every hour.
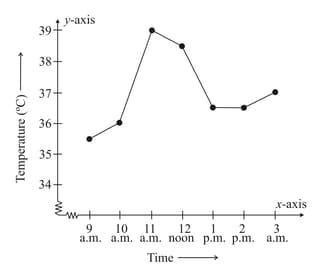
If the patient's temperature is at ., write as the final answer.
The following graph shows the number of instruments sold on different number of months
(The -axis gives the number of month under consideration.)
What is the difference between the maximum and minimum amount of sales?
A certain amount of water was heated and the temperature at different intervals of time was observed and recorded in the graph.
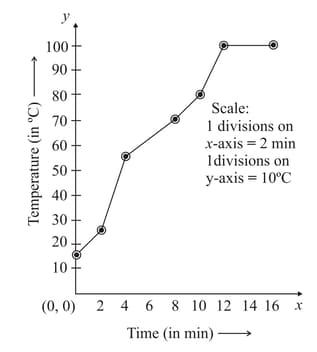
If the temperature of water reach after minutes, write as the final answer.


