Circle Graph or Pie Chart
Important Questions on Circle Graph or Pie Chart
Following is a pie chart showing the amount spent in rupees (in thousands) by a company on various modes of advertising for a product.

Which type of media advertising is the least amount of the total?
Following is a pie chart showing the amount spent in rupees (in thousands) by a company on various modes of advertising for a product.
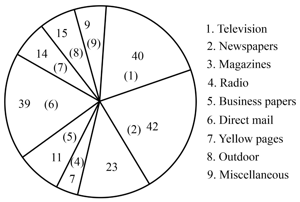
Which type of media advertising is the greatest amount of the total?
The pie chart on the right shows the result of a survey carried out to find the modes of travel used by the children to go to school. Study the pie chart and answer the questions that follow.

How many children use taxi to travel to school if the total number of children is ?
The pie chart on the right shows the result of a survey carried out to find the modes of travel used by the children to go to school. Study the pie chart and answer the questions that follow.

If children travel by car, how many children took part in the survey?
The pie chart on the right shows the result of a survey carried out to find the modes of travel used by the children to go to school. Study the pie chart and answer the questions that follow.
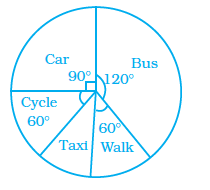
What fraction of children travels by car?
The pie chart on the right shows the result of a survey carried out to find the modes of travel used by the children to go to school. Study the pie chart and answer the questions that follow.

What is the most common mode of transport?
Given below is a pie chart showing the time spend by a group of children in different games. Observe it and answer the questions that follow.

Which is greater-number of children who spend hours or more per day or number of children who play for less than one hour?
Given below is a pie chart showing the time spend by a group of children in different games. Observe it and answer the questions that follow.

How many children spend or lesser hours in playing games?
Given below is a pie chart showing the time spend by a group of children in different games. Observe it and answer the questions that follow.
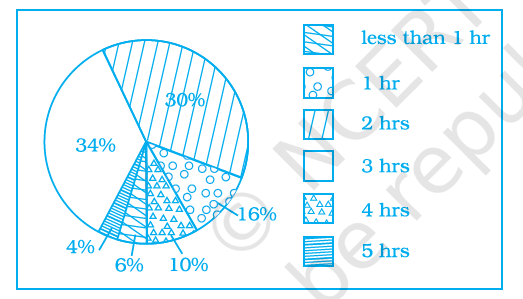
How many children spend more than hours in playing games?
Given below is a pie chart showing the time spend by a group of children in different games. Observe it and answer the questions that follow.
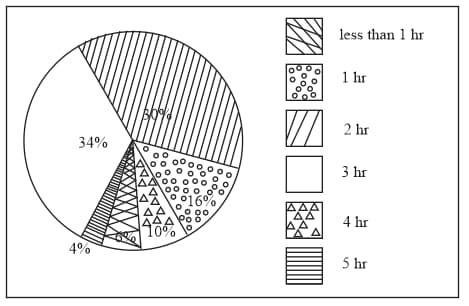
How many children spend at least one hour in playing games?
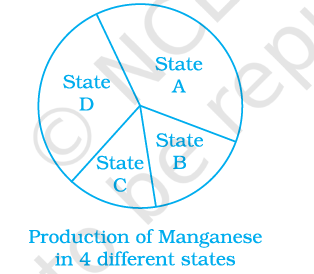
From the given pie chart, we can infer that production of Manganese is least in state .
In a pie chart two or more central angles can be equal.
In a pie chart two central angles can be of .
Sum of all the central angles in a pie chart is .
The central angle of a sector in a pie chart cannot be more than .
In a pie chart a whole circle is divided into sectors.
A pie chart is used to compare _____to a whole.
Data represented using circles is known as
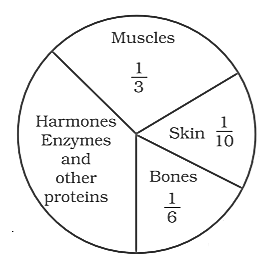
The following pie chart represents the distribution of proteins in parts of a human body.
What is the central angle of the sector (in the below pie chart) representing hormones enzymes and other proteins.

The following pie chart represents the distribution of proteins in parts of a human body.
What is the central angle of the sector (in the below pie chart) representing skin and bones together?