
Tally Marks
Important Questions on Tally Marks
The given bar chart shows the quantity of milk given by four goats on a particular day. Look at the bar graph and answer the following.

Which goat gave of milk in a day?(A/B/C/D)
The given bar chart shows the quantity of milk given by four goats on a particular day. Look at the bar graph and answer the following.
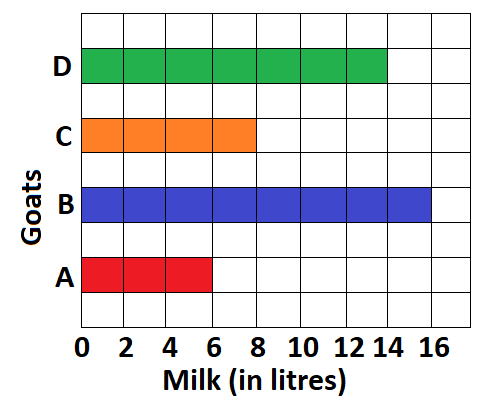
Which goat gave the largest quantity of milk?
The given bar chart shows the quantity of milk given by four goats on a particular day.

Which goat gave the least quantity of milk?(A/B/C)
The given bar chart shows the quantity of milk given by four goats on a particular day. Look at the bar graph and answer the following.

How much milk did goat give in the day If of milk, then find the value of .
The students of class V of Modem RVS school decide to record the mode of transport they use to come to school. They make the bar graph as follows.
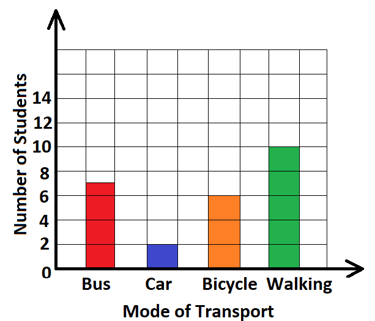
The environmental-friendly mode of coming to school are bicycle and _____.
The students of class V of Modem RVS school decide to record the mode of transport they used to come to school. They make the bar graph as follows.
Read the graph and answer the question.

The total number of students in class V is _____.
The students of class V of Modem RVS school decide to record the mode of transport they used to come to school. They make the bar graph as follows.
Read the graph and answer the question.

The title of the graph can be _____.(mode of transportation to school / mode of transportation to playground)
The students of class of Modem RVS school decide to record the mode of transport they used to come to school. They make the bar graph as follows.

The number of students is shown on the _____ axis.
The students of class V of Modem RVS school decide to record the mode of transport they use to come to school. They make the bar graph as follows.
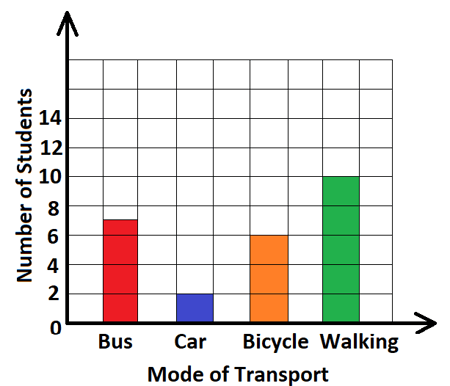
Maximum number of students go to school by _____.
The students of class V of Modem RVS school decide to record the mode of transport they use to come to school. They make the bar graph as follows.

The number of modes of transport for coming to school shown in the above figure is _____.
The circle graph (pie chart) shows the number of items purchased by a coffee shop. Looking at the circle graph, answer the following question.

Are the number of chocolate cakes purchased equal to of the total number of items?
The circle graph (pie chart) shows the number of items purchased by a coffee shop. Looking at the circle graph, answer the following question.
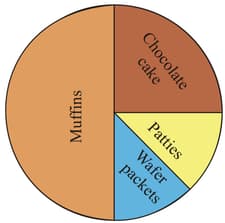
Are the number of patties purchased equal to the number of wafer packets?
The circle graph (pie chart) shows the number of items purchased by a coffee shop. Looking at the circle graph, answer the following question.

Are the number of chocolate cakes purchased more/less than the number of muffins?
The following bar graph shows the number of students in a class of present on different days of a particular week. From the given bar graph, answer the following question.

On which day were students present?
The following bar graph shows the number of students in a class of present on different days of a particular week. From the given bar graph, answer the following question.

How many students were present on Friday?
The following bar graph shows the number of students in a class of present on different days of a particular week. From the given bar graph, answer the following question.
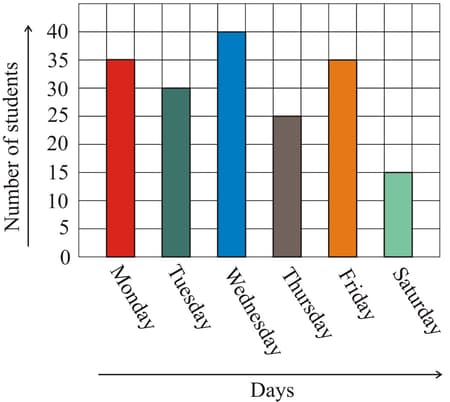
On which day were the minimum number of students present?
The following bar graph shows the number of students in a class of present on different days of a particular week. From the given bar graph, answer the following question.

On which day were the maximum number of students present?
Use the following information to make a tally chart.
| Grade received in art and craft team | Number of students |
| A | |
| B | |
| C | |
| D |
Using a tally chart, represent the following information.
| Newspaper | Number of people reading newspaper in a locality |
| Times of country | |
| Our times | |
| Hindu times | |
| Economy times | |
| Express times |
The students of class V of Modem RVS school decide to record the mode of transport they use to come to school. They make the bar graph as follows.
Read the graph and answer the question.

What is better-traveling by personal car or a carpool? Why? _______.


