
Use of Bar Graphs with a Different Purpose
Use of Bar Graphs with a Different Purpose: Overview
This topic explains how to draw a bar graph using data. It also teaches us on how to understand it and how to analyse the statistical data so that we can easily visualize the use of data.
Important Questions on Use of Bar Graphs with a Different Purpose
From the data given below showing the minimum and the maximum temperature of various cities, plot a double bar graph and answer the following:
| Cities | Ahmedabad | Amritsar | Bangalore | Chennai | Delhi | Jaipur | Jammu | Mumbai |
|---|---|---|---|---|---|---|---|---|
| Max Temp(°C) | ||||||||
| Min Temp(°C) |
Name the city which has the least difference between its minimum and the maximum temperature.
From the data given below showing the minimum and the maximum temperature of various cities, plot a double bar graph and answer the following:
| Cities | Ahmedabad | Amritsar | Bangalore | Chennai | Delhi | Jaipur | Jammu | Mumbai |
|---|---|---|---|---|---|---|---|---|
| Max Temp(°C) | ||||||||
| Min Temp(°C) |
Name two cities where maximum temperature of one was less than the minimum temperature of the other.
From the data given below showing the minimum and the maximum temperature of various cities, plot a double bar graph and answer the following:
| Cities | Ahmedabad | Amritsar | Bangalore | Chennai | Delhi | Jaipur | Jammu | Mumbai |
|---|---|---|---|---|---|---|---|---|
| Max Temp(°C) | ||||||||
| Min Temp(°C) |
(ii) Which is the hottest city and which is the coldest city?
Consider this data collected from a survey of a colony.
| Favorite Sports | Cricket | Basket Ball | Swimming | Hockey | Athletics |
|---|---|---|---|---|---|
| Watching | |||||
| Participating |
Which is more preferred, watching or participating in sports?
Consider this data collected from a survey of a colony.
| Favourite Sports | Cricket | Basketball | Swimming | Hockey | Athletics |
|---|---|---|---|---|---|
| Watching | |||||
| Participating |
Which sport is the most popular?
The performance of a student in Term and Term is given. Draw a double bar graph choosing appropriate scale and answer the following:
| Subjects | English | Hindi | Math | Science | Social science |
|---|---|---|---|---|---|
| term (max marks ) | |||||
| term (max marks ) |
Has the performance gone down in any subject?
The performance of a student in Term and Term is given. Draw a double bar graph choosing appropriate scale and answer the following:
| Subjects | English | Hindi | Math | Science | Social science |
|---|---|---|---|---|---|
| term (max marks ) | |||||
| term (max marks ) |
In which subject is the improvement the least?
Numbers of children in six different classes are given below. Represent the data on a bar graph.
| Class | Fifth | Sixth | Seventh | Eighth | Ninth | Tenth |
|---|---|---|---|---|---|---|
| Number of Children |
Find the ratio of students of class six to the students of class eight.
Numbers of children in six different classes are given below. Represent the data on a bar graph.
| Class | Fifth | Sixth | Seventh | Eighth | Ninth | Tenth |
|---|---|---|---|---|---|---|
| Number of Children |
Answer the following question:
Which class has the maximum number of children? And the minimum?
Read the bar graph which shows the number of books sold by a bookstore during five consecutive years and answer the following question:
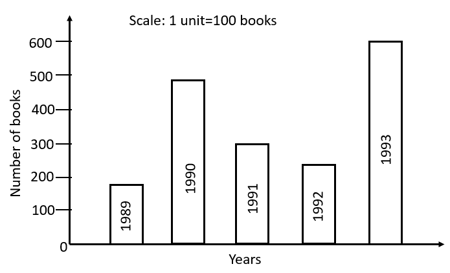
Number of books sold in are just less than _____
Read the bar graph which shows the number of books sold by a bookstore during five consecutive years and answer the following question:
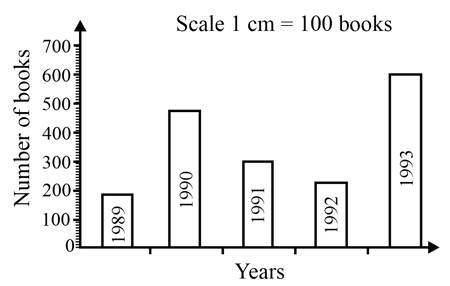
Can you explain how you would estimate the number of books sold in ?
Read the bar graph (Fig) which shows the number of books sold by a bookstore during five consecutive years and answer the following question:
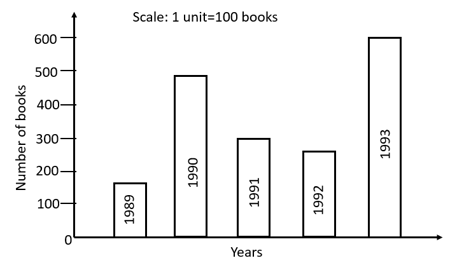
In which year books sold?
Read the bar graph which shows the number of books sold by a bookstore during five consecutive years:

In which year were about books sold?
Use the bar graph given below to answer the following question.
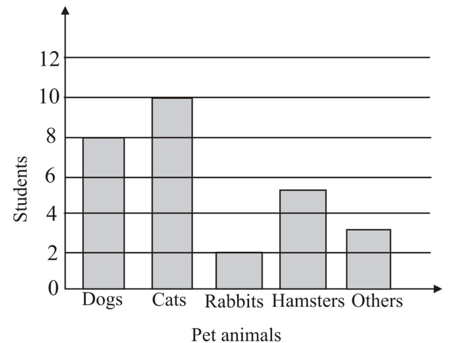
How many students have dog as a pet?
From the data given below showing the minimum and the maximum temperature of various cities, plot a double bar graph and answer the following:
| Cities | Ahmedabad | Amritsar | Bangalore | Chennai | Delhi | Jaipur | Jammu | Mumbai |
|---|---|---|---|---|---|---|---|---|
| Max Temp(°C) | ||||||||
| Min Temp(°C) |
Which city has the largest difference in the minimum and maximum temperature on the given date?
Consider this data collected from a survey of a colony.
| Favourite Sports | Cricket | Basketball | Swimming | Hockey | Athletics |
|---|---|---|---|---|---|
| Watching | |||||
| Participating |
Draw a double bar graph choosing an appropriate scale. What do you infer from the bar graph?
The performance of a student in Term and Term is given. Draw a double bar graph choosing appropriate scale and answer the following:
| Subjects | English | Hindi | Math | Science | Social science |
|---|---|---|---|---|---|
| term (max marks ) | |||||
| term (max marks ) |
In which subject has the child improved his performance the most?
Numbers of children in six different classes are given below. Represent the data on a bar graph.
| Class | Fifth | Sixth | Seventh | Eighth | Ninth | Tenth |
|---|---|---|---|---|---|---|
| Number of Children |
How would you choose a scale?
Use the bar graph to answer the following question.
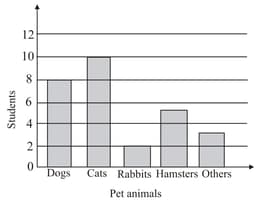
Which is the most popular pet?


