
Line Graph
Important Questions on Line Graph
The following table shows the rate of interest per annum on the fixed deposits by Reserve Bank of India during .
| Year | ||||||||
| Rate |
Depict the information by drawing a graph.
The following table shows the shopkeeper's sale of grocery items (in thousands) during Jan to June .
| Months | Jan | Feb | March | April | May | June |
| Sale (in thousands) |
Draw a line graph for above information.
The runs scored by two teams and in first overs are given below :
| Overs | ||||||||||
| Team A | ||||||||||
| Team B |
Draw a graph depicting the data, making the graphs on same axes.
The sales of a commodity in the first week of March are given below:
| Date | |||||||
| Sales (in ) |
Draw a line graph representing the above data.
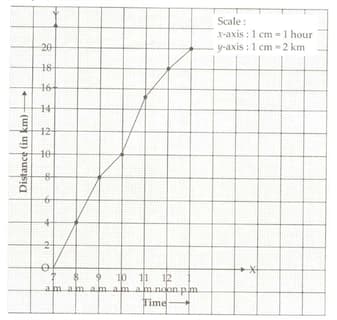
A person cycles from a town to a neighbouring sub-urban area. His distance from the town at different times is shown by the following graph.
During which period did he ride fastest?
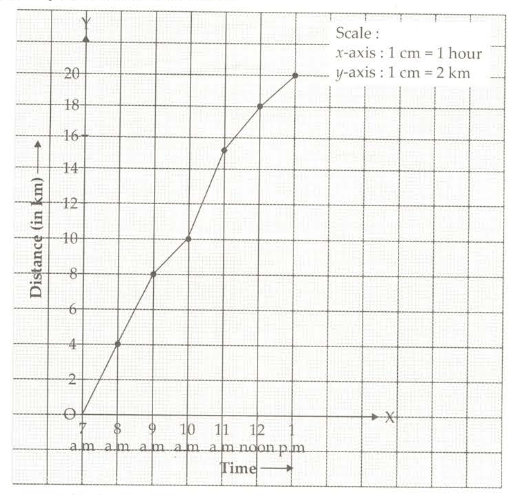
A person cycles from a town to a neighbouring sub-urban area. His distance from the town at different times is shown by the following graph.
How much is the distance between town and sub-urban area?
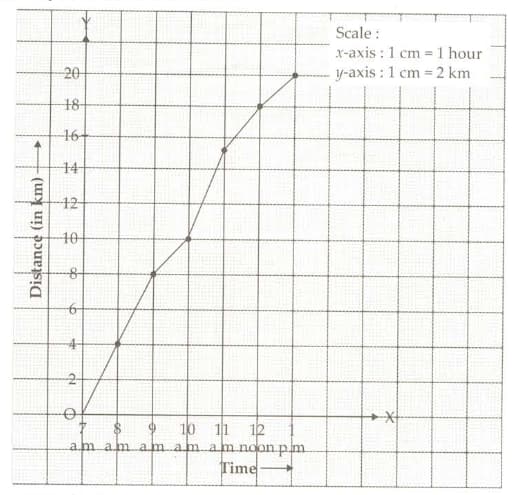
A person cycles from a town to a neighbouring sub-urban area. His distance from the town at different times is shown by the following graph.
How much time did the person take for the travel?

A person cycles from a town to a neighbouring sub-urban area. His distance from the town at different times is shown by the following graph.
What is the scale taken for the time axis?
The temperature of a patient, with fever, was taken at different times on a particular day during hospitalisation:
| Time | ||||||
| Temp (in F) |
Draw the time-temperature line graph.


