Pie Charts and Infographics
Pie Charts and Infographics: Overview
This topic covers concepts, such as, Understanding Pie Charts with Values in Percentages / Fractions, Drawing Pie Charts with Given Data & Understanding Infographics etc.
Important Questions on Pie Charts and Infographics
The following table shows the number of buyers of four different brands of bathing soaps.
| Brand | Number of buyers |
Represent the above data by a pie chart.
The following data shows the agricultural production in India during a certain year.
| Foodgrain | Production (in millions of tonnes) |
| Rice | |
| Wheat | |
| Coarse cereals | |
| Pulses |
Represent the above data by a pie chart.
The data on religion wise division of workers of a factory are given below:
| Religion | Number of students |
| Hindu | |
| Muslim | |
| Sikh | |
| Christian |
Represent the above data by a pie chart.
Various modes of transport used by students in a given school are given below:
| Mode of transport | Number of students |
| School bus | |
| Private bus | |
| Bicycle | |
| Rickshaw | |
| On foot |
Represent the above data by a pie chart.
There are creatures in a zoo as per list given below:
| Creatures | Number of creatures |
| Beast animals | |
| Other land animals | |
| Birds | |
| Water animals | |
| Reptiles |
Represent the above data by a pie chart.
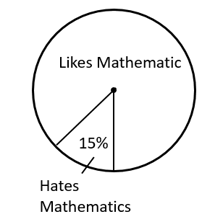
The following pie chart gives you the information about the students in the class who likes hates mathematics subject. Find the fraction of the circle representing students who hates mathematics. Write the fraction in simplest form.
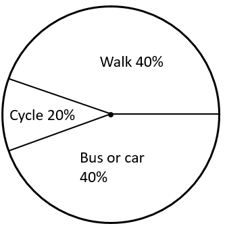
The following pie chart depict the information about the mode of transportation used by the students in a class. Find the fraction of the circle representing number of students who use cycle as mode of transportation. Write the fraction in the simplest form.
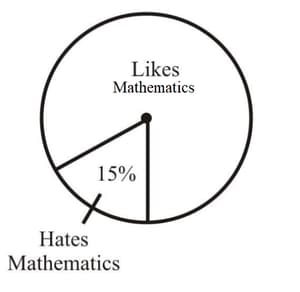
The following pie chart gives you the information about the students in the class who likes hates mathematics subject. Find the fraction of the circle representing students who likes mathematics.