
Median of Grouped Data
Median of Grouped Data: Overview
This topic covers concepts such as Median, Median as the Middle Most Observation in the Data, Median for Even Number of Data, Median for Odd Number of Data, Finding Median of Data Using Cumulative Frequency Tables, Median of Grouped Data, etc.
Important Questions on Median of Grouped Data
Arjun rolled a die a number of times and recorded her results in a bar graph, as follows:
![[image]](https://sss.embibe.com/cdn-cgi/image/q=75,f=auto,fit=scale-down/https://sss.embibe.com/content-grail/preprod/306bb32a-2b7a-41b0-8fd9-5924ac5398ee.gif)
What was the median score?
In his end of year exams, Joe scored the following:
Science
English
History
Math
Geography
What was the mode?
In his end of year exams, Joe scored the following:
Science
English
History
Math
Geography
What was the median?
Calculate the median of the following frequency distribution table :
| Class-interval | Frequency |
Find the the median of first seven composite numbers.
Find the median of the following data:
The weights of boys are given in the following distribution table:
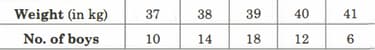
Find the upper quartile.
The weights of boys are given in the following distribution table:

Find the lower quartile.
The weights of boys are given in the following distribution table:

Find the median.
Mode and mean of a data are and, respectively. Find the median of the data.
In a certain distribution, mean and median are and , respectively. Find the mode of the distribution, using an empirical relation?
The marks obtained by students in a Mathematics test are given below.
Draw an ogive for the given distribution on a graph sheet. Use a scale of units on both axis. Use the ogive to estimate the number of students who did not pass in the test if the pass percentage was .
Find the median of the following distribution:
| Measure of shoes | ||||||||||
| No of shoes |
Find the median of the following distribution:
Find the median from the following frequency distribution
| Class Interval | ||||||
Find the median form following frequency distribution
| Class | ||||||||
| Frequency |


