
Bar Graphs
Bar Graphs: Overview
This topic covers concepts such as Tabular Representation of Data, Bar Graph, Understanding a Bar Graph, Drawing a Bar Graph, Types of Bar Graph, Double Bar Graph for Data Having Two Types, and Drawing a Double Bar Graph.
Important Questions on Bar Graphs
Study the following table and answer the questions based on it.
Expenditures of a Company (in Lakh Rupees) per Annum Over the given Years.
| Year | Item of Expenditure | ||||
| Salary | Fuel and Transport | Bonus | Interest on Loans | Taxes | |
Total expenditure on all these items in was approximately what percent of the total expenditure in
Read the following table carefully and answer the questions given below
PRODUCTION OF T.V BY DIFFERENT COMPANIES IN 2010 (in thousand)
| COMPANY | A | B | C | D | E | F |
| PRODUCTION OF T.V. | 1.14 | 3.25 | 1.27 | 2.85 | 3.73 | 1.06 |
| RATIO | ||
| COMPANY | URBAN | RURAL |
| A | 2 | 3 |
| B | 7 | 6 |
| C | 3 | 7 |
| D | 5 | 1 |
| E | 3 | 2 |
| F | 1 | 3 |
What is the average of number of T.V. sold in rural area by company F and number of T.V. sold in urban area by company D?
Read the following table carefully and answer the questions given below .
Number of books of different subjects in various book stores -
| Books | Book store | |||||
| A | B | C | D | E | F | |
| Maths | 560 | 560 | 540 | 400 | 200 | 420 |
| Science | 550 | 290 | 560 | 240 | 680 | 520 |
| Hindi | 450 | 240 | 410 | 560 | 610 | 560 |
| English | 230 | 400 | 670 | 820 | 520 | 210 |
| Sanskrit | 230 | 210 | 230 | 500 | 200 | 500 |
| Geography | 590 | 890 | 530 | 430 | 360 | 480 |
What is the difference between the total number of books of Science and English in all the book stores together?
Study the table carefully to answer the questions that follow:-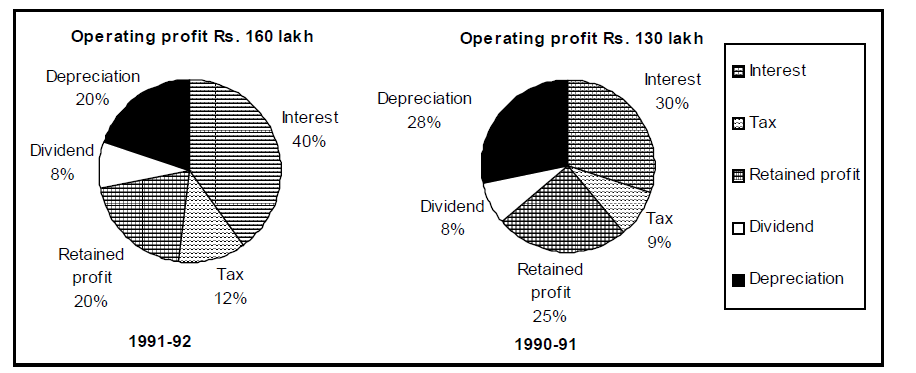
: If on an average, 20% rate of interest was charged on borrowed funds, then the total borrowed funds used by this company in the given two years amounted to
Read the following table carefully answer the questions given below
MARK OBTAINED BY 6 STUDENTS IN DIFFERENT SUBJECTS
| STUDENT | BUSINESS STUDY (75) | MATHS (120) | ACCOUNTANCY (150) | FINE ARTS(80) | ECONOMICS (60) |
| SIDDHARTHA | 34 | 111 | 76 | 71 | 33 |
| RITU | 54 | 77 | 100 | 53 | 36 |
| RAHUL | 64 | 98 | 99 | 60 | 54 |
| KISHAN | 48 | 101 | 108 | 48 | 45 |
| SUJEET | 70 | 95 | 121 | 72 | 24 |
| RADHA | 60 | 100 | 120 | 46 | 30 |
By which of the following students is the marks obtained in Business study equal to the average marks in Business study?
The table given below shows the income (in rupees) together with their sources, received by 5 employees of a company during the last month of a particular year.
Study the table carefully and answer the questions.
| Employee Source of Income | A | B | C | D | E |
| Salary | 12000 | 6000 | 21000 | 9000 | 12000 |
| Bonus | 2400 | 1200 | 4500 | 2400 | 3000 |
| Overtime | 5400 | 2100 | 6000 | 5100 | 6000 |
| Arrears | 6000 | 5400 | 12000 | 4200 | 7500 |
| Miscella neous | 1200 | 300 | 1500 | 300 | 1500 |
| Total | 27000 | 15000 | 45000 | 21000 | 30000 |
How many employees have their salaries more than four times the income from bonus?
Study the following table carefully and answer the question that follow.
Major currencies in dollar terms
| Date | Pound sterling | Deutsche mark | Yen 100(Units) | Euro |
| -Jul | ||||
| -Jul | ||||
| -Aug | ||||
| -Aug | ||||
| -Aug |
On which date the value of Euro was maximum against Dollar?
Study the following table carefully to answer the question given below.
Marks obtained by six students in five different subjects:
| Subject -----> Student |
Business study | Mathematics | Accountancy | Financial MGT | Economics |
| Shyam | |||||
| Krishna | |||||
| Rahul | |||||
| Radha | |||||
| Leena | |||||
| Ram |
In which subject did Shyam score the maximum marks out of a hundred?
Study the graph carefully the answer the questions that follow:
Number of students passed (in thousands) from two universities over the years.
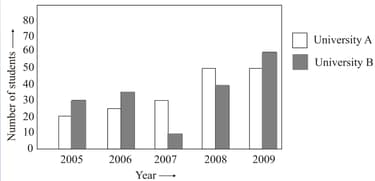
What is the difference between the total number of students passed from both the universities in the year together and the total number of students passed in year from both the universities together?
The frequency diagram shows the amount of sleep (in hours) of a group of people.
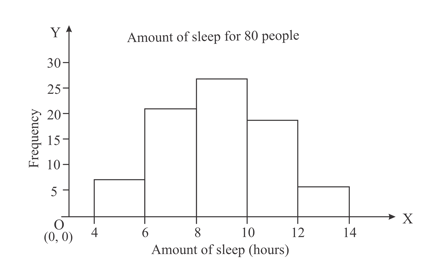
How many people slept for between hours? and Caroline slept for hours last night how can you tell she was not one of the people.
Construct a double bar graph, using the table given below:
Suppose population of India and China are
Construct a double bar graph, using the table given below:
The figure is a bar graph showing the number of students in different clubs of the school:
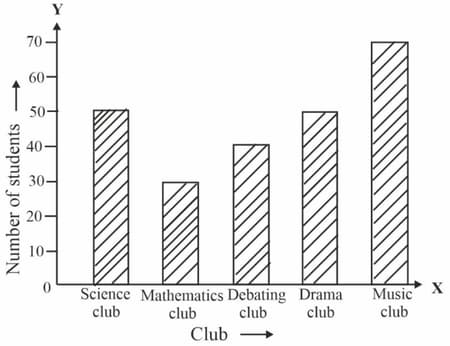
_____ club is most popular among the students?
The histogram given depicts the marks obtained by students of class in English. Look at the histogram and answer the following questions.
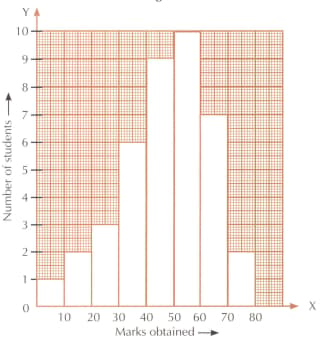
What is the class size?
The histogram given alongside shows the frequency distribution of the age of teachers in a school.
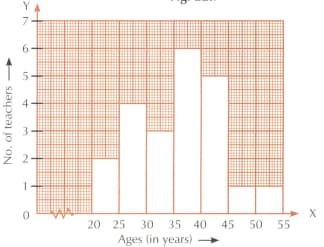
Using the histogram, answer the following.
What are the class marks of the classes?
Observe the following graph and answer the question:
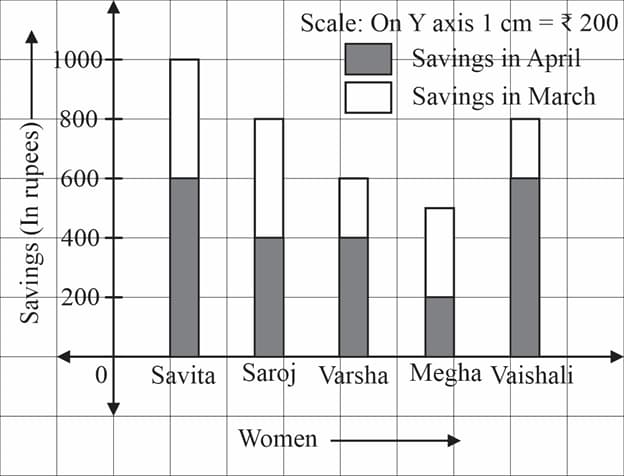
If the savings of Vaishali of in March month is , then find the value of .
Observe the following graph and answer the question:

Find the total savings of Saroj in the months of March and April in .
The following table shows the number of visitors to a park for the months January to March.
| Month | January | February | March |
| Number of visitors |
Construct a horizontal bar chart for the table.
The following bar shows the number of family members in a house in a particular society.
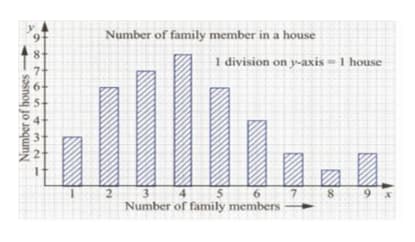
What is the total number of people in the society?
The following bar graph shows the number of family members in a house in a particular society.
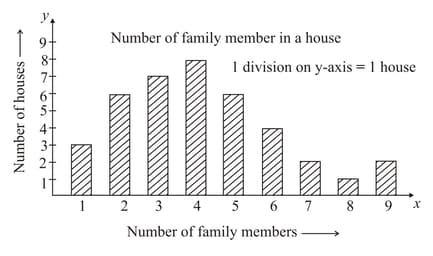
What is the total number of houses in the society?


