
Graphical Representation of Grouped Frequency Distribution
Graphical Representation of Grouped Frequency Distribution: Overview
In this topic, we will discuss the details of histogram and its interpretation. Also, we will study the construction of a histogram. Moreover, we will explore the idea of frequency polygon along with its characteristics.
Important Questions on Graphical Representation of Grouped Frequency Distribution
Draw an ogive for the following distribution.
| Class Interval | |||||
| Frequency |
Construct the histogram with the following frequency table:
| Class Interval | |||||
| Frequency |
Construct the histogram with the following frequency table:
| Class Interval | |||||
| Frequency |
Construct the histogram with the following frequency table:
| Class | ||||
| Frequency |
Construct the histogram with the following frequency table:
| Class Interval | |||||
| Frequency |
The following distribution gives the mass of objects measured to the nearest gram. Draw a histogram to illustrate the data.
| Mass in (grams) | 25-34 | ||||
| No. of objects |
Draw a histogram for the following table which represent the marks obtained by students in an examination:
| Marks | ||||||||
| Number of students |
Construct a histogram for the following data.
| Class interval | ||||||
| Frequency |
Draw the histogram for the data of weekly wages of workers in a factory given in the following table.
| Weekly wage | ||||||
| No of workers |
Consider the grouped frequency distribution of number of tenders received by a department from the contractors for a civil work in a course time.
| Class intervals | Number of tenders |
Draw a frequency polygon for the data.
The following table gives the marks obtained by the students.
| Marks obtained | Number of students |
Draw a frequency polygon for the data.
The following table gives the marks obtained by the students.
| Marks obtained | Number of students |
Draw a frequency polygon for the data.
The following table gives the marks obtained by the students.
| Marks obtained | Number of students |
Draw a frequency polygon for the data.
Draw the histogram for the data of students with different levels of intelligent Quotient (IQ).
| IQ | |||||||
| Number of students |
In a city, the weekly observations made in a study on the cost of livingindex are given in the following table:
| Class of living index | Number of weeks |
Draw a frequency polygon for the data.
The following table gives the lifetime of lamps:
| Life time(in hours) | Number of lamps |
Draw a frequency polygon curve for given data.
Draw a frequency polygon for the given data without drawing histogram:
| Class interval | Frequency |
In a study of an unknown viral fever in a city, the following data was obtained:
| Ages | |||||
| No of patients |
Draw a frequency polygon without drawing the histogram.
Draw a frequency polygon for the given data without drawing histogram:
| Class interval | Frequency |
The heights of girls of Class of a school are recorded as follows.
A 'more than type' ogive for the above data is
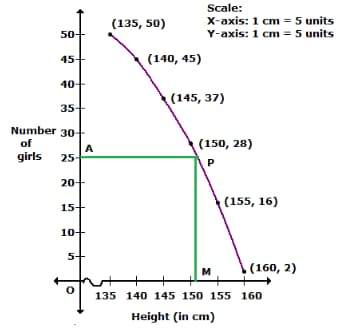
The median is


