
Histogram of Grouped Data
Histogram of Grouped Data: Overview
This topic covers concepts, such as Histogram of Grouped Data, Difference between a Histogram and a Bar Graph, Modifications in Lengths of Rectangles in Histograms of Varying Widths & Drawing Histograms of Varying Widths etc.
Important Questions on Histogram of Grouped Data
Directions: Study the following histogram and answer the following questions.
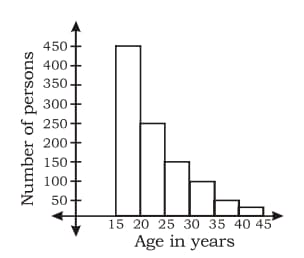
The total number of persons in the age group of years to years is:
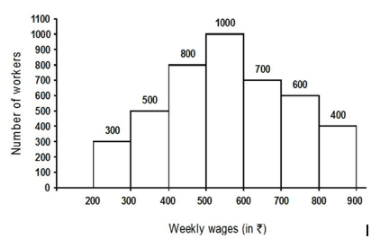
Adjoining Histogram of weekly wages of workers. The ratio of the number of workers receiving less than wages to the number of workers receiving more than is -
The graphical representation of cumulative frequency distribution is called-
Histogram is used for presentation of the following type of series.
In histogram, the _____ of each bar represents the value whereas in bar chart the _____ of each bar represents the values that they represent.
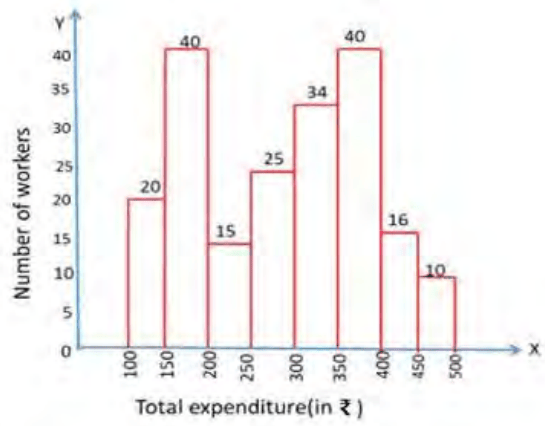
The following histogram represents the distribution of total household expenditure (in ₹) of 200 manual workers in a city.
 .
.
The number of workers whose total expenditure is and above is what percentage less than the number of workers whose total expenditure is less than ?
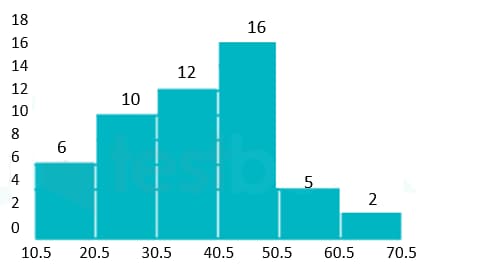
The histogram given below presents the frequency distribution of average runs scored by selected players from a district in local cricket tournament.
Study the histogram and answer the question that follows.
 .
.
How many players scored runs or less?
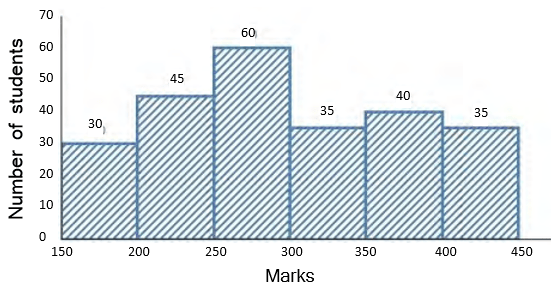
Study the histogram showing the marks obtained by students in an examination and then answer the given question.
 .
.
The number of students who got marks between and is what percent more than the number of students who got or more marks?
Study the given bar graph shows the life time of neon lamps and the number of neon lamps and answer the question that follows.

The number of neon lamps having life hours or more but less than hours is what percent of the total number of neon lamps having life hours or more?
Some persons went on an outstation tour. The histogram shows their ages.
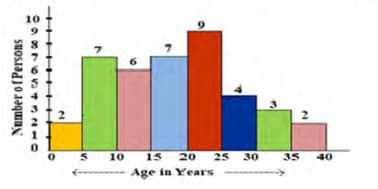
If the children of age less than got concession, then how many persons got the concession?
Study the given bar graph shows the life time of neon lamps and the number of neon lamps and answer the question that follows.
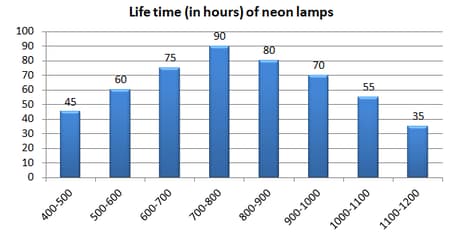
The number of neon lamps having life hours or more but less than hours are what percent of the total number of neon lamps having life hours or less?
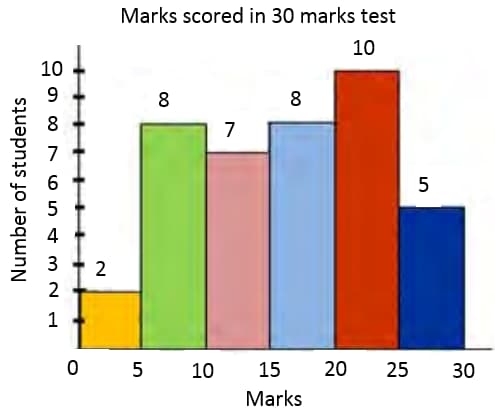
The histogram shows the marks scored by students in a test with maximum marks. How many students scored or more marks?
 .
.
The histogram shows the marks scored by students in a test with maximum marks.
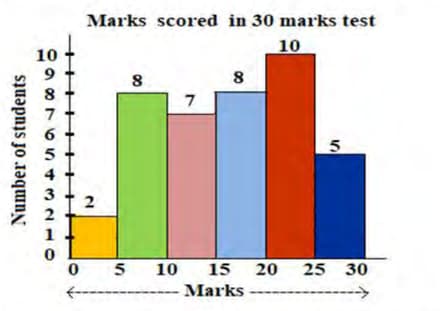
What is the ratio of the number of students who scored marks in the class intervals taken together to that of the students in the class intervals taken together?
The histogram shows the marks scored by students in a test with maximum marks.

What is the percentage of the students who scored less than marks?
Some persons went on an outstation tour. The histogram shows their ages:
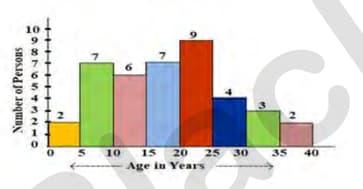
How many persons are less than of age?
The histogram shows the marks scored by students in a test with maximum marks.

What is the percentage of the students who scored less than marks?
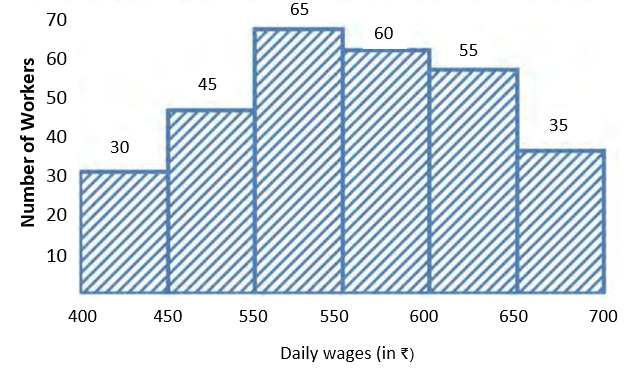
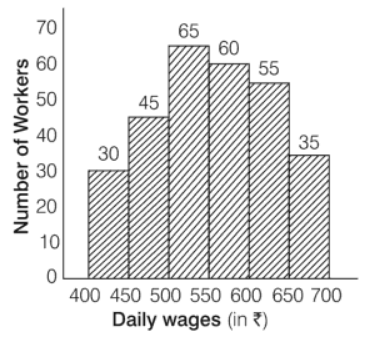
Study the graph which shows the daily wages with number of workers and answer the question that follows.
 .
.
If the ratio of the total number of workers whose daily wages are less than to the total number of workers whose daily wages are or above is , then what is the difference between and .
The histogram shows the weights of students of class in a school.
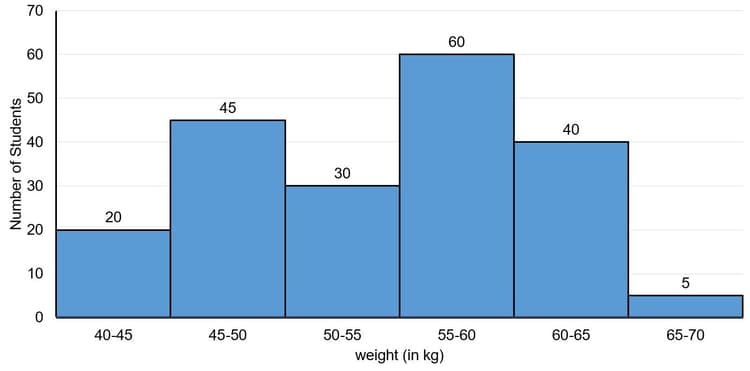
Let be the number of students whose weight is less than and be the number of the students whose weight is greater than or equal to . What is the value of ?
Study the given graph which shows the number of workers with their wages and answer the question that follows:
 .
.
What is the ratio of the total number of worker whose daily wages are or above but less than to the total number of workers whose daily wages are or above?
The following histogram represents the distribution of household expenditure (in ) of manual workers in a city.
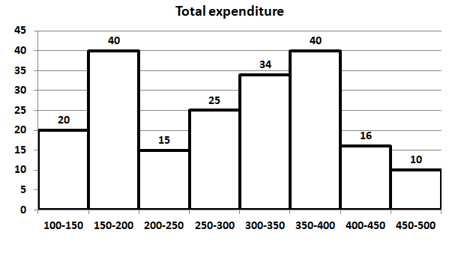
The ratio of the number of workers whose household expenditure is less than to the number of workers whose household expenditure is less than is _____.


