
Basic Graphical Representations
Basic Graphical Representations: Overview
This topic covers concepts such as Graphical Representation of Data, Bar Graph, Understanding a Bar Graph, Drawing a Bar Graph, Types of Bar Graph, Histograms, Understanding Histograms, Construction of Histograms, Representation of Data, etc.
Important Questions on Basic Graphical Representations
Two different finance companies declare fixed annual rate of interest on the amounts invested with them by investors. The rate of interest offered by these companies may differ from year to year depending on the variation in the economy of the country and the banks' rate of interest. The annual rate of interest offered by the two Companies P and Q over the years are shown by the line-graph provided below. Answer the questions based on this graph.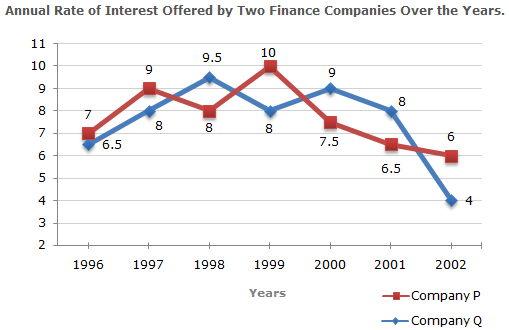
An investor invested Rs.5 lakhs in company Q in 1996. After one year, the entire amount along with the interest was transferred as investment to Company P in 1997 for one year. What amount will be received from Company P, by the investor?
Study the pie-chart carefully to answer the questions given below:
The pie-charts shows the percentage quantity of fruits at two fruit shops A and B.
The quantity of Orange at Shop A is what percent more than that of Apple at Shop B?
The following pie-chart shows the sources of funds to be collected by the National Highways Authority of India (NHAI) for its Phase II projects. Study the pie-chart and answers the question that follow.
Sources of funds to be arranged by NHAI for Phase II projects (in Rs. crores)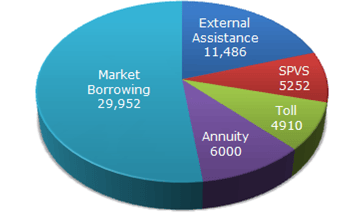
Nearly about 20% of the funds are to be arranged through:
Study the following line graph and answer the questions.
Exports from Three Companies Over the Years (in Rs. crore)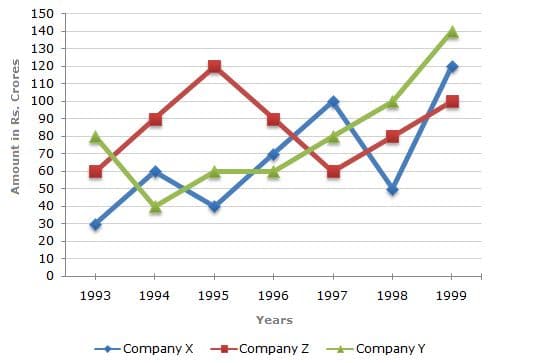
IAverage annual exports during the given period for Company Y is approximately what percent of the average annual exports for Company Z?
The circle-graph given here shows the spending of a country on various sports during a particular year. Study the graph carefully and answer the questions given below it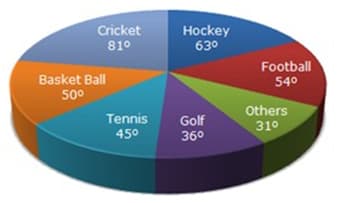
How much percent less is spent on Football than that on Cricket?
Study the following table and answer the questions based on it.
Expenditures of a Company (in Lakh Rupees) per Annum Over the given Years.
| Year | Item of Expenditure | ||||
| Salary | Fuel and Transport | Bonus | Interest on Loans | Taxes | |
Total expenditure on all these items in was approximately what percent of the total expenditure in
Read the following table carefully and answer the questions given below
PRODUCTION OF T.V BY DIFFERENT COMPANIES IN 2010 (in thousand)
| COMPANY | A | B | C | D | E | F |
| PRODUCTION OF T.V. | 1.14 | 3.25 | 1.27 | 2.85 | 3.73 | 1.06 |
| RATIO | ||
| COMPANY | URBAN | RURAL |
| A | 2 | 3 |
| B | 7 | 6 |
| C | 3 | 7 |
| D | 5 | 1 |
| E | 3 | 2 |
| F | 1 | 3 |
What is the average of number of T.V. sold in rural area by company F and number of T.V. sold in urban area by company D?
Read the following table carefully and answer the questions given below .
Number of books of different subjects in various book stores -
| Books | Book store | |||||
| A | B | C | D | E | F | |
| Maths | 560 | 560 | 540 | 400 | 200 | 420 |
| Science | 550 | 290 | 560 | 240 | 680 | 520 |
| Hindi | 450 | 240 | 410 | 560 | 610 | 560 |
| English | 230 | 400 | 670 | 820 | 520 | 210 |
| Sanskrit | 230 | 210 | 230 | 500 | 200 | 500 |
| Geography | 590 | 890 | 530 | 430 | 360 | 480 |
What is the difference between the total number of books of Science and English in all the book stores together?
Study the table carefully to answer the questions that follow:-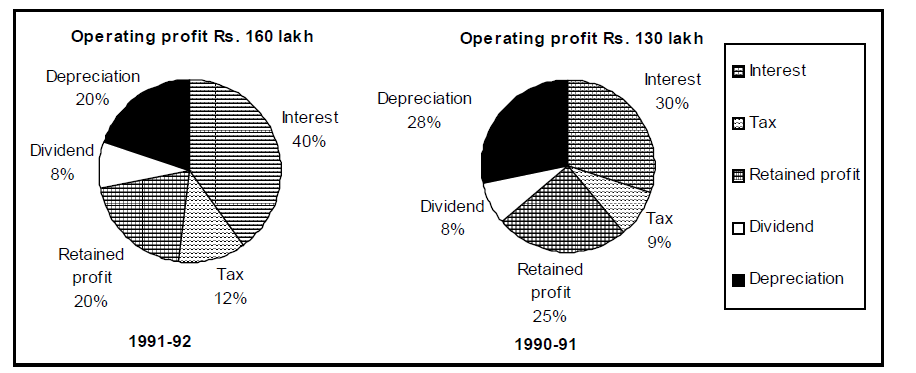
: If on an average, 20% rate of interest was charged on borrowed funds, then the total borrowed funds used by this company in the given two years amounted to
Read the following graph carefully and answer the questions given below.
Number of Passangers (in thousands) travelling by different airlines in three months.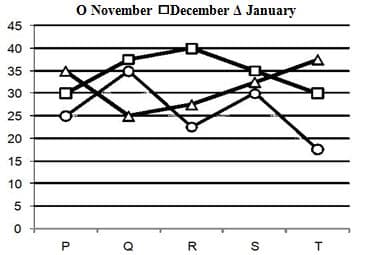
What is the respective ratio of number of passengers travelling by airline R and that by airline T in all the three months?
Two different finance companies declare fixed annual rate of interest on the amounts invested with them by investors. The rate of interest offered by these companies may differ from year to year depending on the variation in the economy of the country and the banks' rate of interest. The annual rate of interest offered by the two Companies P and Q over the years are shown by the line-graph provided below. Answer the questions based on this graph.
An investor invested a sum of Rs.12 lakhs in company P in 1998. The total amount received after one year was reinvested in the same Company for one more year. The total appreciation received by the investor on his investment was:
The pie chart given below shows the monthly expenditure of a students. 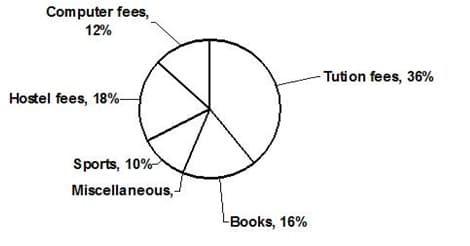
If the expenditure on tution fees is Rs. 7200, the sports fees is -
Read the following table carefully answer the questions given below
MARK OBTAINED BY 6 STUDENTS IN DIFFERENT SUBJECTS
| STUDENT | BUSINESS STUDY (75) | MATHS (120) | ACCOUNTANCY (150) | FINE ARTS(80) | ECONOMICS (60) |
| SIDDHARTHA | 34 | 111 | 76 | 71 | 33 |
| RITU | 54 | 77 | 100 | 53 | 36 |
| RAHUL | 64 | 98 | 99 | 60 | 54 |
| KISHAN | 48 | 101 | 108 | 48 | 45 |
| SUJEET | 70 | 95 | 121 | 72 | 24 |
| RADHA | 60 | 100 | 120 | 46 | 30 |
By which of the following students is the marks obtained in Business study equal to the average marks in Business study?
Study the following graph carefully and answer the given question. Number of students (Males & Females) passed out from various colleges in a year. (Number in thousands) is shown below:
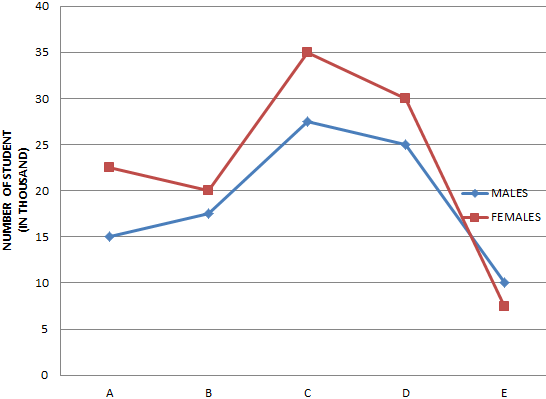
COLLEGES
What is the average number of students (Males & Females) passed out from all the colleges together?
DIRECTIONS : These questions are to be answered on the basis of the pie chart given below showing how a person's monthly salary is distributed over different expense heads.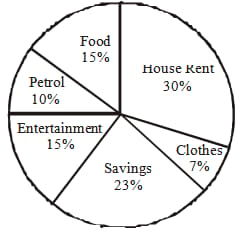
The annual saving for such a person will be approximately:
Study the graph carefully and answer the question that follows.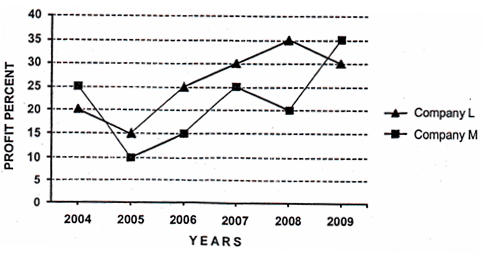
Which of the following statements is TRUE with respect to the above graph?
The table given below shows the income (in rupees) together with their sources, received by 5 employees of a company during the last month of a particular year.
Study the table carefully and answer the questions.
| Employee Source of Income | A | B | C | D | E |
| Salary | 12000 | 6000 | 21000 | 9000 | 12000 |
| Bonus | 2400 | 1200 | 4500 | 2400 | 3000 |
| Overtime | 5400 | 2100 | 6000 | 5100 | 6000 |
| Arrears | 6000 | 5400 | 12000 | 4200 | 7500 |
| Miscella neous | 1200 | 300 | 1500 | 300 | 1500 |
| Total | 27000 | 15000 | 45000 | 21000 | 30000 |
How many employees have their salaries more than four times the income from bonus?
Study the following line graph and answer the questions based on it.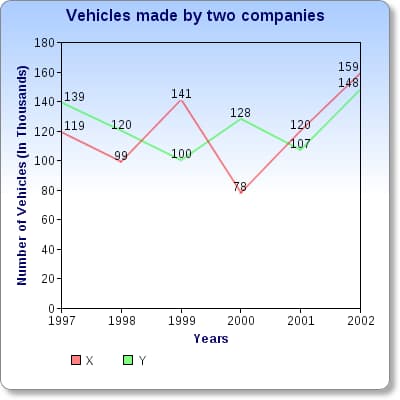
In which of the following years, the difference between the productions of Companies X and Y was the maximum among the given years ?
Study the following table carefully and answer the question that follow.
Major currencies in dollar terms
| Date | Pound sterling | Deutsche mark | Yen 100(Units) | Euro |
| -Jul | ||||
| -Jul | ||||
| -Aug | ||||
| -Aug | ||||
| -Aug |
On which date the value of Euro was maximum against Dollar?
Study the following bar-line graph and answer the questions given below.
Number of two products Punkar and Kazira sold by a company over the years (in thousands)
(All values are multiple of 5000)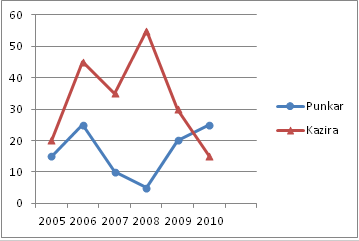
What is the ratio between the total number Punker sold in year 2007, 2009 and 2010 together and the total number of Kazira sold in year 2005, 2007 and 2008?


