
Bar Graph
Bar Graph: Overview
This topic covers concepts such as understanding a bar graph, drawing a bar graph, bar graphs, proper scale for plotting bar graphs, and limitations of using bar graphs.
Important Questions on Bar Graph
A graph that uses vertical bars to represent data is called a
Observe the graph and answer the question:
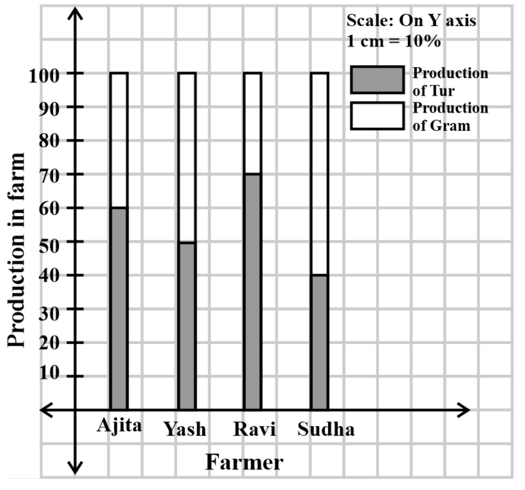
If the Tur production to total production in Ajita’s farm is , then find the value of .
Observe the graph and answer the question:

Name the person whose percentage production of Tur is the least.
In the following table number of trees planted in the year and in four towns is given. Show the data with the help of subdivided bar graph.
| Karjat | Wadgoam | Shivapur | Khandala | |
Observe the following graph and answer the question.
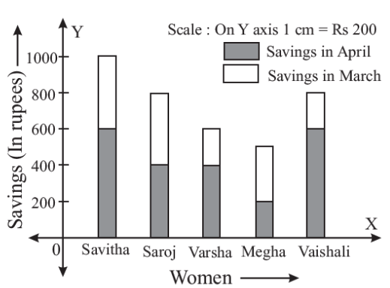
Whose savings in the month of April is the least?
The figure is a bar graph showing the number of students in different clubs of the school:
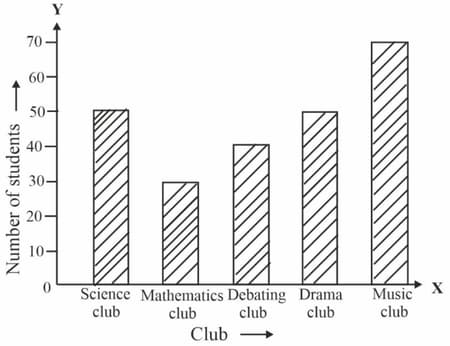
_____ club is most popular among the students?
Observe the following graph and answer the question:
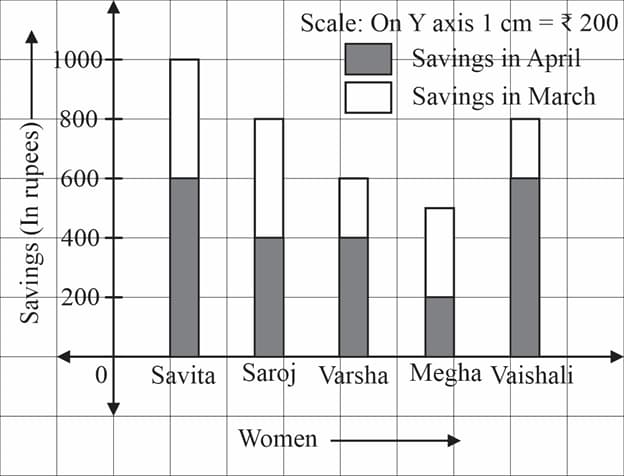
If the savings of Vaishali of in March month is , then find the value of .
Observe the following graph and answer the question:

Find the total savings of Saroj in the months of March and April in .
In Horizontal bar graphs, the data categories are represented on _____ axis.
The following table shows the number of visitors to a park for the months January to March.
| Month | January | February | March |
| Number of visitors |
Construct a horizontal bar chart for the table.
Study this bar graph. It shows the number of mosquitoes Freddie Frog caught each day of the week.
Mosquitoes Freddie Frog caught
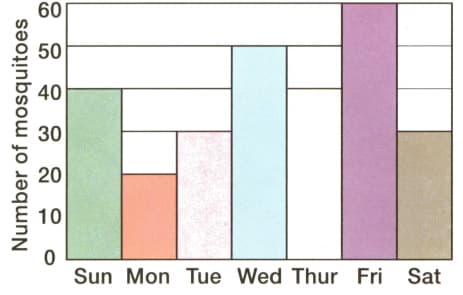
What type of bar graph is it?
The following bar graph represents the amount of rainfall in the Amazon rainforest. Study the bar graph and answer the questions.
Rain in the Amazon rainforest
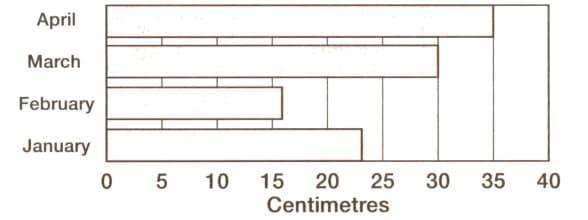
What type of bar graph is it?
Draw a bar graph of the following table which shows the relation between the highest temperature in month from March to July.
| Months | March | April | May | June | July |
| Highest Temperature() |
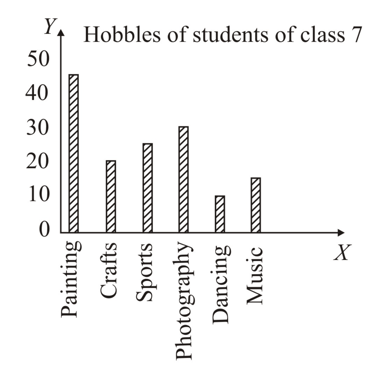
How many more students enjoy photography as compared to crafts?
The following bar shows the number of family members in a house in a particular society.
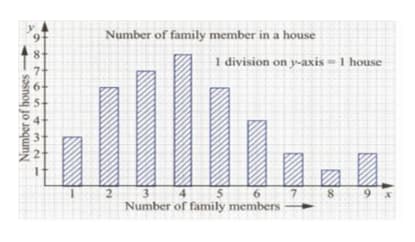
What is the total number of people in the society?
The following bar graph shows the number of family members in a house in a particular society.
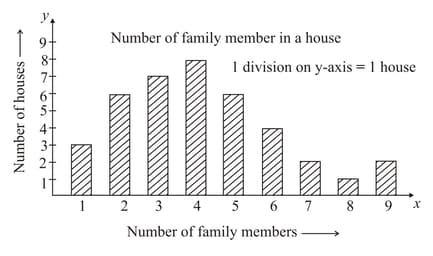
What is the total number of houses in the society?
The following bar shows the number of family members in a house in a particular society.
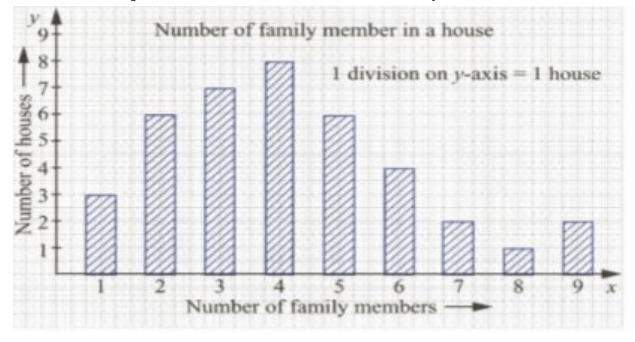
What is the largest number of people in a house? How many houses have them?
Look at the bar graph shown below.
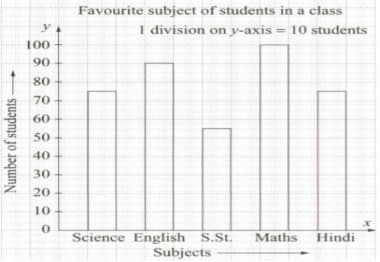
How many more students like English as compared to Social Studies?
A bar graph is drawn to the scale , then a bar of length represents


