Data Handling
Data Handling: Overview
This topic covers concepts, such as Statistics, Data in Statistics, Data Handling, Class Limits in Grouped Data & Grouped Frequency Distribution Table etc.
Important Questions on Data Handling
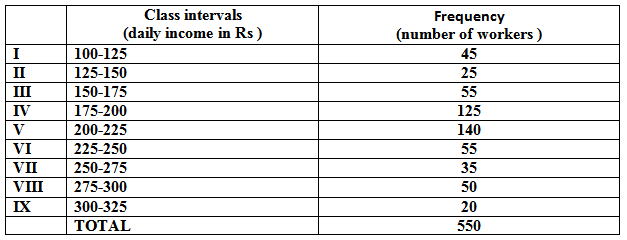
Study the table and answer the following question.
The frequency distribution of the daily income of workers of a factory is given below:

The tally mark  shows frequency _____.
What is the degree of exactness of measurement when compared to the expected value of the variable being measured?
Representation of data in the form of a picture is called _____.
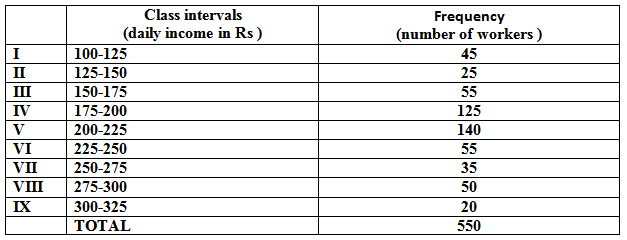
Study the table and answer the following question.
The frequency distribution of the daily income of workers of a factory is given below:

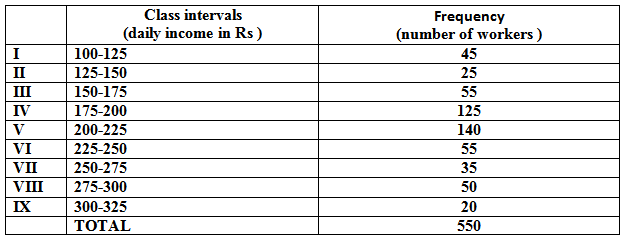
Study the table and answer the following question.
The frequency distribution of the daily income of workers of a factory is given below:

Which class has the lowest frequency?
In graphical representation of data, ideographs are also called as
In a graphical representation of data, the largest numerical value is the smallest numerical value is . If classes desired are then class interval is_____.
Data collected on religion from the census reports are
Ten matches data is given. Then which of the following cannot be found?
Census reports are used as a source of _________ data
Arrange the following households in ascending order of per capita income.
| Name of Household | Total Income of Household | Size of the Household |
| Rajat | 6000 | 5 |
| Raman | 5000 | 5 |
| Suman | 3200 | 4 |
| Priya | 8400 | 6 |
If Samir withdraws from his bank account by submitting a self cheque in bank for making payments and he also gave a account Pay cheque for issued by his employer in his favour. Now what happens to the Balance in his account?
The daily wage of a person in rural area is Rs. 200 an the poverty line for a person is fixed at Rs. 800 per month for rural areas. Following table shows the detail of employment of four families living in a village. Identify the family living below poverty line:
| Family | Total days of Employment of got in a month by the family | Members of family |
| Ram | 10 | 2 |
| Radha | 18 | 3 |
| Raju | 12 | 4 |
| Pooja | 25 | 5 |
A survey shows that , and of the people watched ' idiots', 'Rajneeti', and 'Avatar', respectively. Twenty-five percentage people watched exactly two of the three movies, and watched none. What percentage of people watched all the three movies?
Frequency density corresponding to a class interval is the ratio of
According to Neyman’s allocation, in stratified sampling:
According to Neyman's allocation in stratified sampling:
Which sampling provides separate estimates for population means for different segments and also an overall estimate?
In _________ method(s) information can be gathered by the researcher himself by contacting the interviewee:
