
Bar Graph of Unclassified Data
Bar Graph of Unclassified Data: Overview
This topic explains concepts such as Bar Graphs, Drawing Bar Graphs, Representing Data in Bar Graphs, Choosing Scales to Draw Bar Graphs, etc.
Important Questions on Bar Graph of Unclassified Data
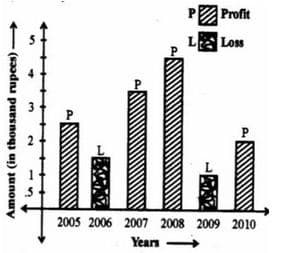
Find Difference between maximum loss and second least profit.?
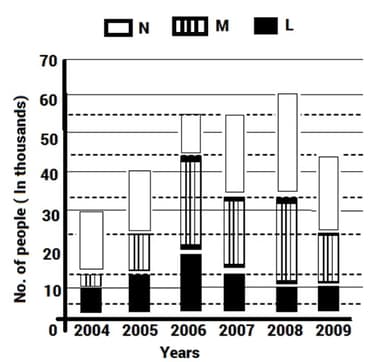
Study the given graph carefully to answer the questions that follow-
Number of people (In thousands) using three different types of mobile services over the years
A cosmetic company provides five different products. The sales of these five products (in number of packs) during and are shown in the following bar graph.
Sales (in number of packs) of five different products of Cosmetic Company during and .
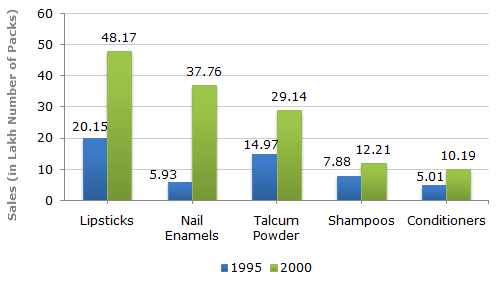
The sales have increase by nearly from to in the case of?
Directions : The following is the bar chart of Results of Annual Examination of boys and girls of classes Y to X. Study the bar chart and answer the questions.
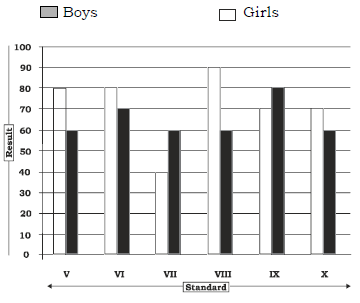
In which pair of standard are the results of girls and boys in inverse proportion?
Direction: The bar graph given below shows the data for the production of paper (in ) by three different companies and over the years.

In which year was the percentage of production of the company to the production of the Company the maximum?
The following bar chart shows the composition of the GDP two countries (India and Pakistan).
Composition of GDP of Two Countries
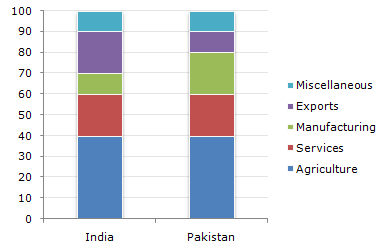
If the total GDP of India is , then the GDP accounted for by Agriculture, Services and Miscellaneous is ?
Answer the questions based on the following graph.
Revenue was obtained by a publishing house while selling books, magazines and journals (in).
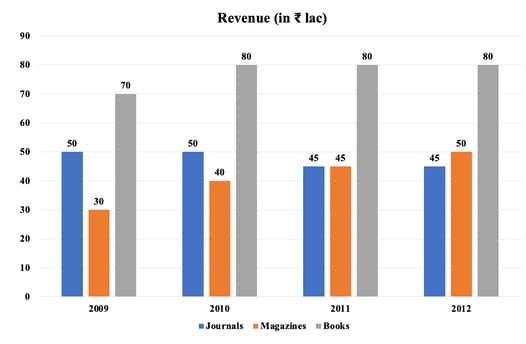
The total revenue generated from journals to is ____.
Answer the question based on the following bar graph.
The bar graph shows the percentage shares of different categories in financial assets of Indian households.
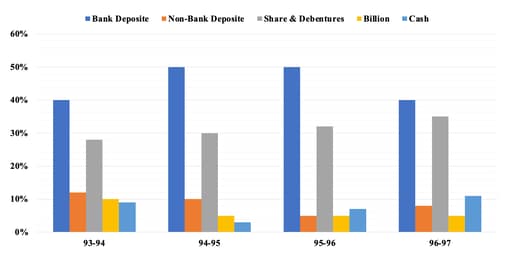
Which of the following categories showed a consistent growth in percentage share of total assets?
DIRECTIONS : Study the following graph carefully and answer the questions given below:
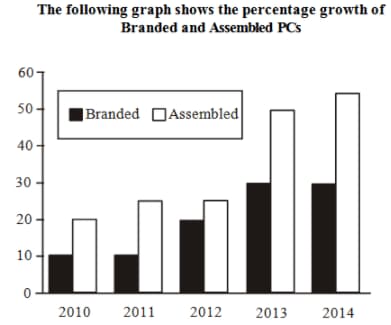
If the Branded PCs sold in were , how many Branded PCs were sold in ?
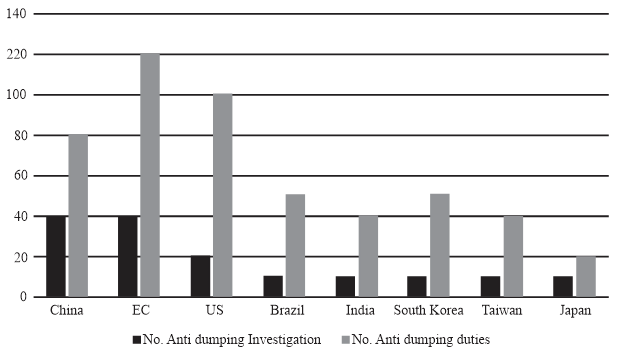
The proportion of anti-dumping investigations to the number of anti-dumping duties in progress for a China-Taiwan combine is
Study the bar chart and answer the question below:
The bar graph provided below gives the data of the production of paper (in lakh tons) by three different companies over the years.
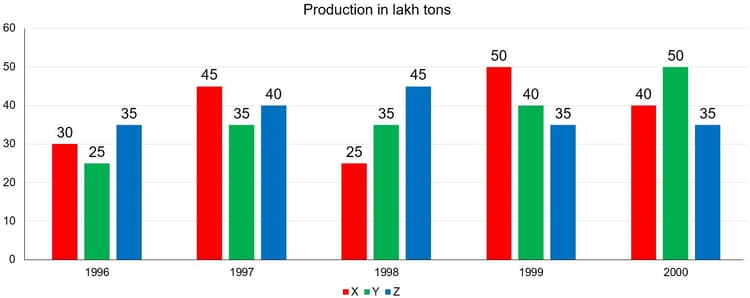
In which year the percentage of production of Company Z to the production of company Y is maximum?
Study the following graph and answer the questions that follow:
Number of students (in ) who opted for three different specialisations during the given five years in a university.
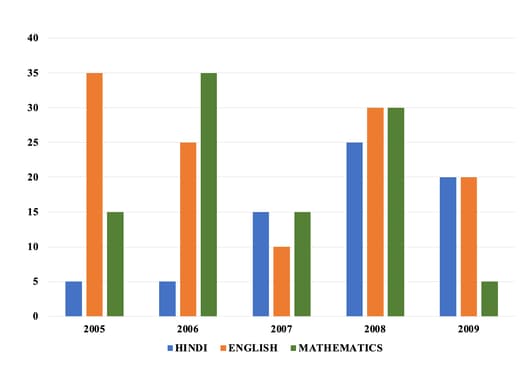
Out of the total number of students who opted for the given three subjects, in the year were girls. How many boys opted for Mathematics in the same year?
Study the following graph and answer the questions given
Result of Annual Examination In a High School
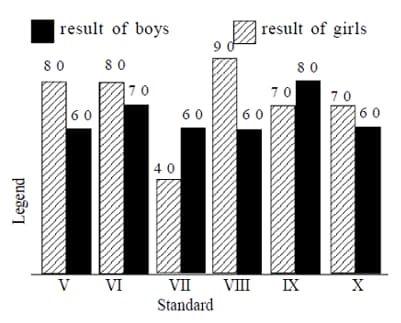
In which standard is the result of the girls less than the average result of the boys of the school?
Study the following graph and answer the questions given
Result of Annual Examination In a High School
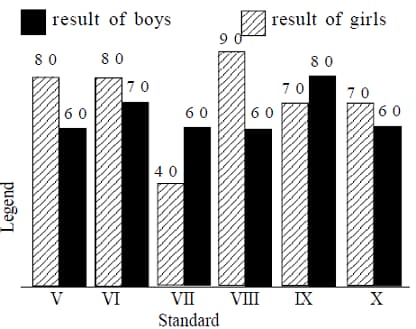
In which standard is the difference be- tween the results of girls and boys maximum?
Study the following graph carefully and answer the following questions below it.
The number of students studying in various colleges from various faculties (Number in thousands).
What is the ratio of the students from the faculty of Science from colleges H and I together to the students
from the same faculty from colleges J and K together?
Study the information given and answer the following questions.
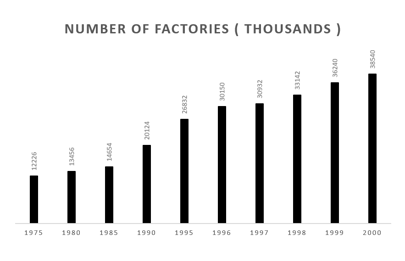
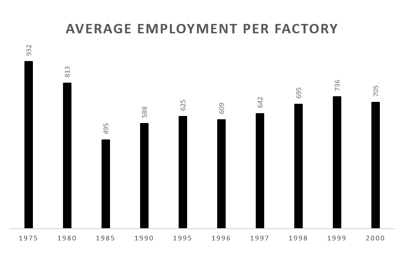
Between and , in which year has the average employment per factory shown an increment compared to previous year, but decreased in the next year?
Observe this graph and answer questions.
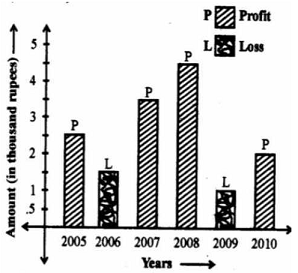
If the loss is of the profit for the years under study, then x is equal to_____.
Study the following graph carefully and answer the following questions.
Demand and Production of colour T.V. of five companies for October 1988.
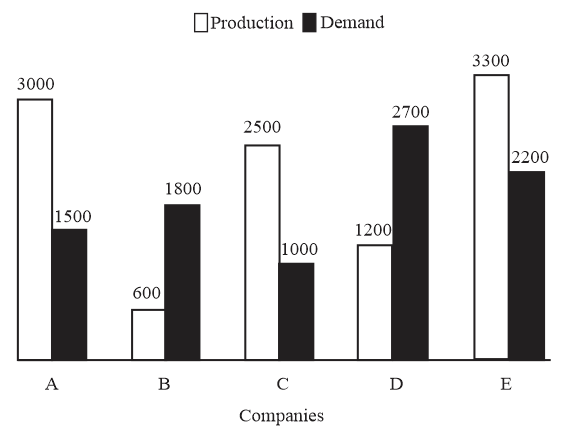
Find the ratio of production of company A to the production of company D.
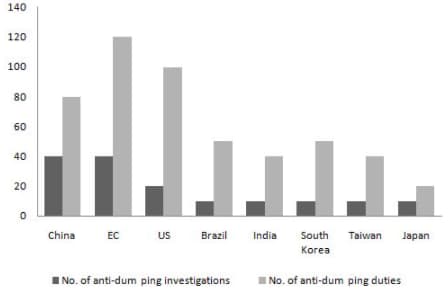
The total number of anti-dumping investigations currently in progress is equal to_____.
Study the bar chart and answer the question below:
The bar graph provided below gives the data of the production of paper (in lakh tons) by three different companies over the years.

What is the percentage increase in the production of Company Y from to ?


