
Line Graphs
Line Graphs: Overview
This topic covers concepts, such as, Line Graph, Understanding Time - Distance Line Graphs, Line Graphs with Non-uniform Intervals & Plotting Single Line in a Line Graph etc.
Important Questions on Line Graphs
Answer the given question based on the following data:
The below graph represents the Export of Cashew nuts in Quantity and Values from the USA during .
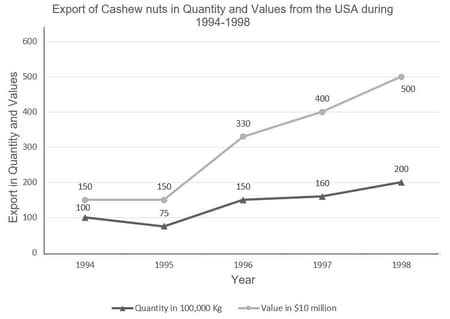
If in cashew nuts were exported at the same rate per kg as that in , what would be the value of exports (in ) in ?
Study and answer the given question based on the following data.
The below line graphs represents the quantity of wheat exports over the years.
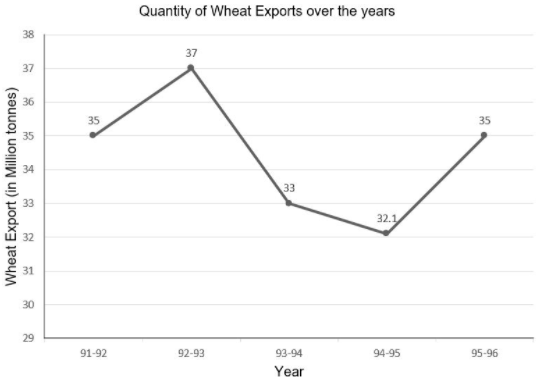
The below line graphs represents the quantity of wheat exports over the years.
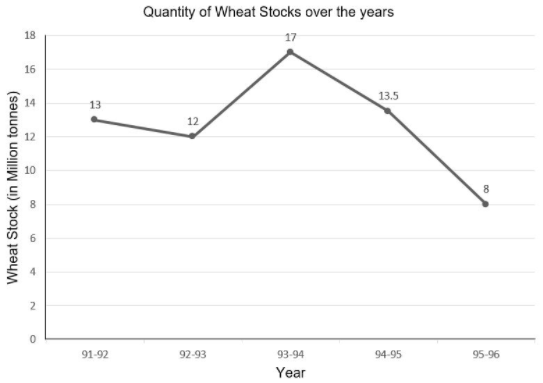
The greatest percentage change in wheat stocks, over the previous year, has been seen in _________.
Directions: Study the graph carefully to answer the questions that follow
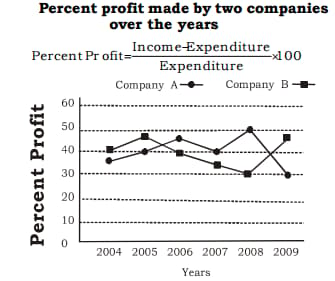
If the amount of profit earned by Company A in the year was Rs lakhs, what was its expenditure in that year?
Study the following graph carefully to answer the questions that followed. The following line graph gives distance (in ) travelled by five different trucks in a day.
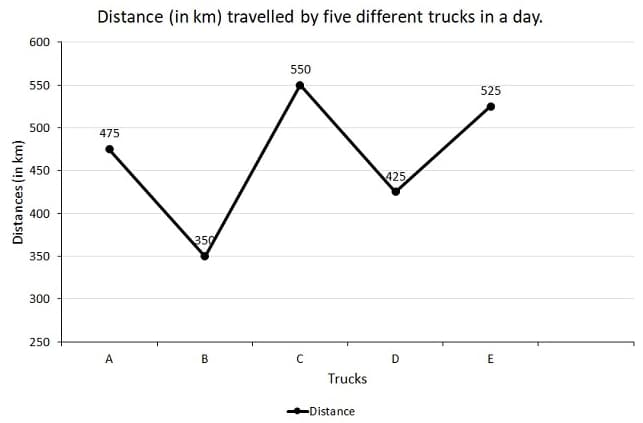
What is the respective ratio of the distance travelled by truck A to the distance travelled by truck D?
The following line graph shows the ratio of female and male employees working in two companies A and B.
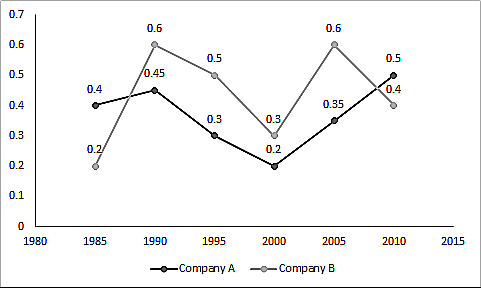
If in the year , Male employees working in Company A then what is the number of female employees working there in the same year?
Study the following line graph which gives the number of students who joined and left the school in the beginning of the year for six years from to and answers questions based on the line graph given below:
The initial strength of the school in was .

Study the following line graph to answer the question.
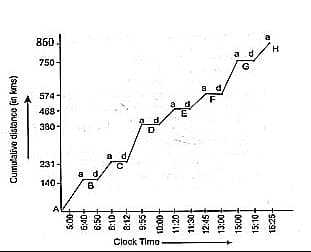
Railway Time Schedule of an Express Train X Running Between City A and City H
- Arrival of a train
- Departure of a train
and - Cities through which the train runs.
- Indicates stoppage/halting of the train at the city station.
If the train stops at each city for more time than that of what it is at the moment, then at what time will it reach the city after departing from City as per schedule?
Directions: Study the graph carefully to answer the questions that follow

If in the year the expenditures incurred by Company A and B were the same, what was the ratio of the income of Company A to that of company B in that year?
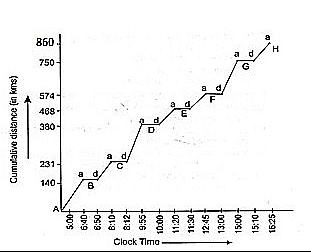
Study the following line graph to answer these question
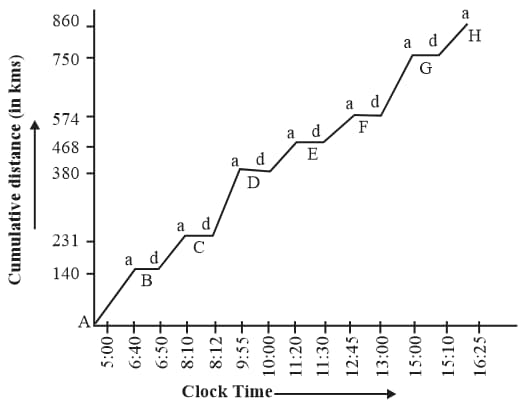
Railway Time Schedule of an Express Train X Running Between City A and City H.
a: Arrival of train, d: Departure of train
A, B, C, D, E, F, G and H - Cities through which the train runs.
a-d: Indicates stoppage/halting of the train at the city station.
The average speed of the train maintained between two successive stations was maximum between
Study the following line graph to answer the question.

Railway Time Schedule of an Express Train X Running Between City A and City H
- Arrival of a train
- Departure of a train
and - Cities through which the train runs.
Indicates stoppage/halting of the train at the city station.
Between how many pairs of consecutive stations does the speed of the train run below the overall average speed for the entire trip?
Study the following line graph to answer the question.
Railway Time Schedule of an Express Train X Running Between City A and City H
- Arrival of a train
- Departure of a train
and - Cities through which the train runs.
- Indicates stoppage/halting of the train at the city station.
Study the following graph carefully and answer the questions given below it. Profit earned by three companies over the years (in)
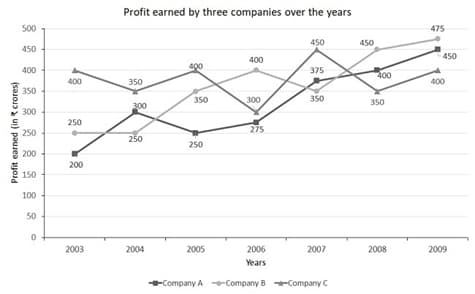
What was the difference between the profit earned by Company A in and profit earned by Company C in ?
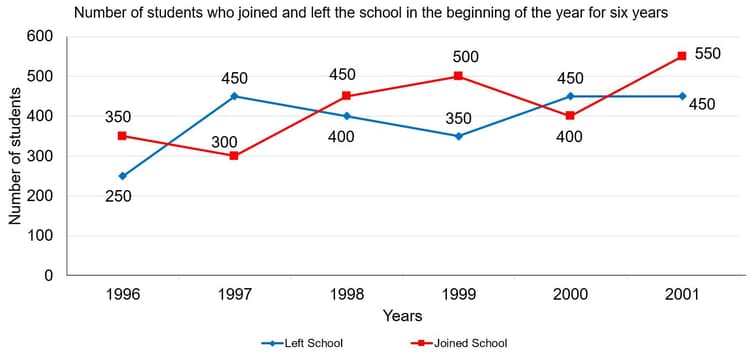
Study the following line graph which gives the number of students who joined and left the school in the beginning of the year for six years from to and answers questions based on the line graph given below:
The initial strength of the school in was .

Study the following line graph which gives the number of students who joined and left the school in the beginning of the year for six years from to and answers questions based on the line graph given below:
The initial strength of the school in was .
Direction : Read the following graph carefully and answer the question given below.
In the line graph the prices (in rupees) of four types of TVs i.e. Sony, Samsung, Sansui, Onida respectively are given for different years.
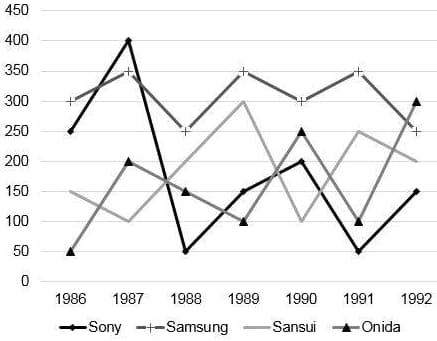
In which year is the average price of all four type of TVs the minimum?
Read the following graph carefully and answer the question given below.
The number of Computers purchased for two stores A and B during six years by store owner.
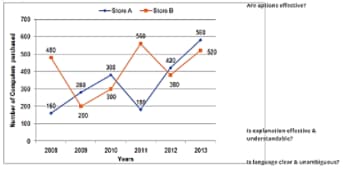
What is the difference between the total number of Computers purchased for store B in 2008, 2009 and 2013 and the total number of Computers purchased for store A in 2009, 2010 and 2008 together?
Read the following graph carefully and answer the question given below.
The number of Computers purchased for two stores A and B during six years by store owner.
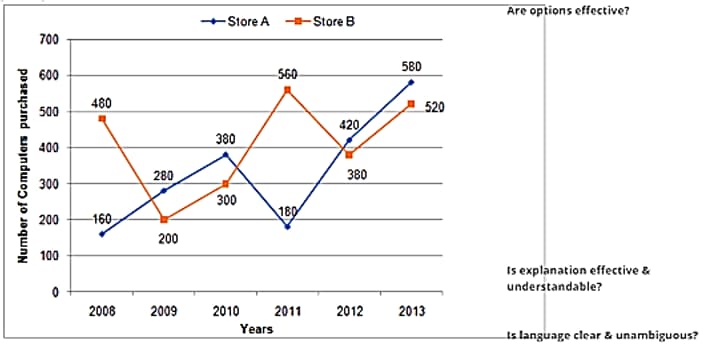
The number of Computers purchased for store B increased by what per cent from 2008 to 2011?
Read the following graph carefully and answer the question given below.
The number of Computers purchased for two stores A and B during six years by the store owner.
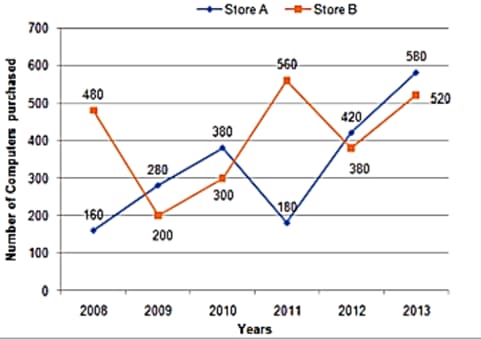
The number of Computers purchased for store A in is what percent of the number of computers purchased for store B in ?
Read the following graph carefully and answer the question given below.
The number of Computers purchased for two stores A and B during six years by store owner.
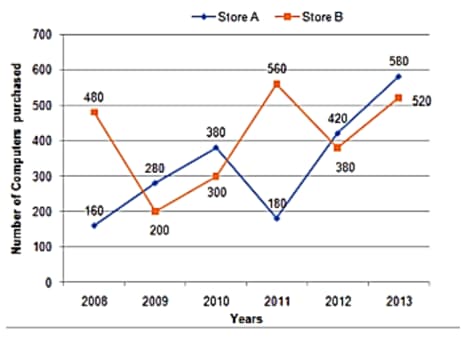
Out of the total number of Computers purchased for store A and B together in , only are Window. What is the total number of Window Computers purchased for store A and B together in ?
Read the following graph carefully and answer the question given below.
The number of Computers purchased for two stores A and B during six years by store owner.
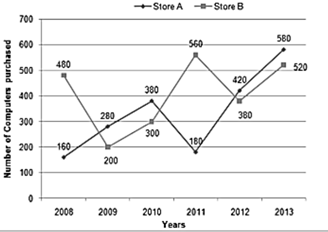
What is the ratio of the total number of Computers purchased for stores A and B together in to the total number of Computers purchased for the two stores together in ?


