Thermodynamic Processes and Indicator Diagrams
Thermodynamic Processes and Indicator Diagrams: Overview
This topic covers concepts such as Indicator Diagrams, Cyclic Process, Adiabatic Process, Isothermal Process, Isobaric Process, and Isochoric Process.
Important Questions on Thermodynamic Processes and Indicator Diagrams
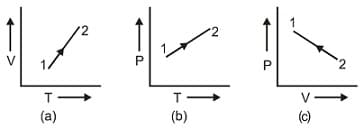
Which one of the following graphs is/are correct for isochoric process?
For an adiabatic process of an ideal gas,
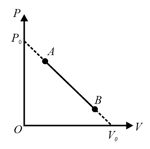
One mole of an ideal monatomic gas undergoes a linear process from to , in which is pressure and its volume change as shown in the figure. The absolute temperature versus volume for the given process is
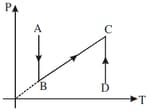
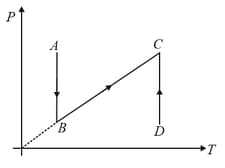
A cycle followed by an engine (made of one mole of an ideal gas in a cylinder with a piston) is shown in figure. The heat exchanged by the engine with the surroundings at constant volume is: (, and are the pressures of the gas at point and point respectively, and is the volume of the gas at point )
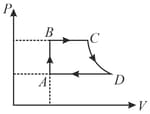
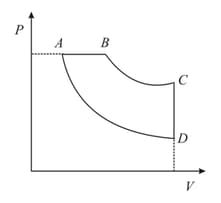
Consider a cycle followed by an engine as shown in figure
to is isothermal
to is adiabatic
to is adiabatic
such a process does not exist because
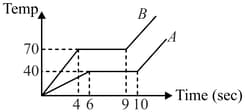
Two solid bodies of equal masses are heated at the same rate under identical condition. The change is temperature is shown graphically as a function of time. The ratio of specific heat in solid form should be
Assertion: Work done in a cyclc process as shown in figure .
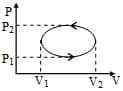
Reason: Magnitude of work done for cyclic process is equal to the area enclosed by the P-V diagram.
One mole of a mono-atomic gas behaving as per at is subjected to reversible isoentropic compression untill final temperature reaches . If the initial pressure was then the value of (final) is -
(given )
In a closed insulated container, a liquid is stirred with a paddle to increase its temperature. In this process, which of the following is true
P-T diagram is shown below then choose the corresponding V-T diagram.
P-T diagram is shown below then choose the corresponding V-T diagram.
The three diagrams below depict three different processes for a given mass of an ideal gas. What information can be drawn regarding the change of (a) pressure, (b) volume and (c) temperature of the gas from the plots as shown in figure (a), (b) and (c), respectively.
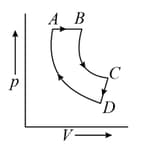
A cyclic process ABCD is shown in the following P-V diagram. Which of the following curves represents the same process?
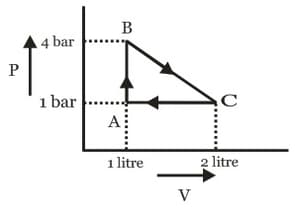
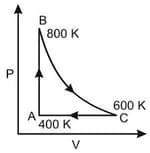
Two moles of an ideal monatomic gas undergoes a cyclic process as shown in diagram. The temperatures in different states are given . Determine the work done by the gas during the cycle:
A cyclic process ABCDA is shown below in the given p-V diagram. In the following answers the one that represents the same process as in p-V diagram
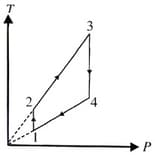
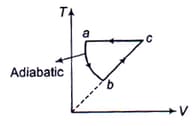
One mole of diatomic ideal gas undergoes a cyclic process, as shown in diagram. The process, is adiabatic. The temperatures at and are and , respectively. Choose the correct statement.
p-V curve for the process whose V-T curve is
The internal energy change when a system goes from state A to B is . If the system goes A to B by a reversible path and returns to state A by an irreversible path what would be the net change in internal energy?
For the adiabatic expansion of an ideal gas :
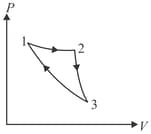
One mole of an ideal gas is carried through the reversible cyclic process as shown in figure. The max. temperature attained by the gas during the cycle :-+