
Graphical Representation of Motion
Graphical Representation of Motion: Overview
This topic covers concepts, such as, Position - Time Graphs, Graphical Analysis of Motion, Displacement - Time Graphs, Distance - Time Graphs, Velocity - Time Graphs, Acceleration - Time Graphs, Speed-time Graph & Some Important Motion Graphs etc.
Important Questions on Graphical Representation of Motion
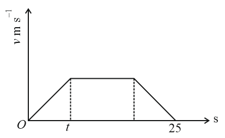
The velocity-time graph of the particle moving along a straight line is shown. The rate of acceleration and deceleration is constant and it is equal to . If average velocity during the motion is , then find the value of
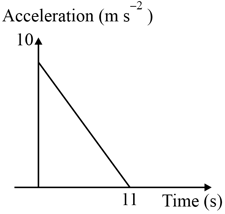
A body starts from rest at time , refer to the acceleration-time graph shown in the figure. The maximum velocity attained by the body will be
Two trains, which are moving along different tracks in opposite directions, are put on the same track due to a mistake. Their drivers, on noticing the mistake, start slowing down the trains when they are 300 m apart. Graphs given below show their velocities as a function of time as they slow down. The separation between the trains, when both have stopped, is :

Which of the following best represents a velocity time graph corresponding to the position time graph shown ?

All the graphs below are intended to represent the same motion. One of them does it incorrectly. Pick it up.
Which graph corresponds to an object moving with a constant negative acceleration and a positive velocity?
The graph below shows the variation with time of the velocity of an object moving on a straight line.

Which of the graphs below best represents the variation with time of the acceleration of the object?
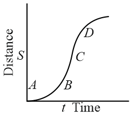
An object is moving along -axis. If its position (in meter) at any time (in ) is given by the following graph, then the object is at rest about

A particle starts its motion from rest and moves with constant acceleration for time and then it retards with constant rate for time until it comes to rest. Then the ratio of maximum speed and average speed during the complete motion will be
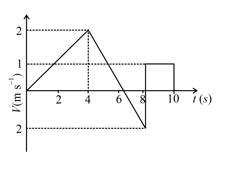
The velocity-time graph of a body moving in a straight line is given below. The displacement of the body in is
A batsman hits a sixer and the ball touches the ground outside the cricket ground. Among the following graph, the one that describes the variation of the cricket ball's vertical velocity with time between the time as it hits the bat and time when it touches the ground is
Select the correct option for the object having a straight line motion represented by the following graph
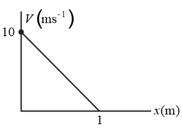
A particle is moving along a straight line. In the above figure, The velocity displacement graph of the particle is shown. Find the velocity as function of .
A particle starts moving from position with a constant velocity . The position-time graph is represented by
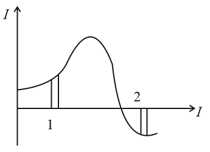
For the given plot of a particle executing one-dimensional motion, consider and to be it's average speed in equal time intervals and respectively. What can you say about and ?
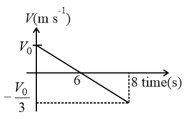
The velocity versus time graph of a particle is given. What is the initial velocity of the particle if the total displacement of the particle is .
Which of the following best represents a velocity time graph corresponding to the position time graph shown ?
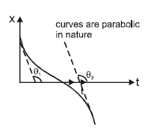
The maximum instantaneous velocity in the above distance- time graph of a particle is around the point
If the height can be expressed as , the value of after is
Position - time graph for motion with zero acceleration is


