Graphical Representation of Motion
Graphical Representation of Motion: Overview
This topic covers concepts such as average acceleration, instantaneous acceleration, displacement - time graphs, and velocity - time graphs.
Important Questions on Graphical Representation of Motion
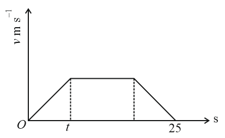
The velocity-time graph of the particle moving along a straight line is shown. The rate of acceleration and deceleration is constant and it is equal to . If average velocity during the motion is , then find the value of
A body is moving with velocity towards east. After 10 seconds its velocity becomes towards north. The average acceleration of the body is
A particle is moving eastwards with a velocity of . In , the velocity changes to northwards. The average acceleration in this time is
The acceleration-time graph of a body starting from rest is shown below
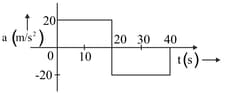
The average acceleration of the body from to is
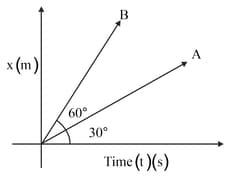
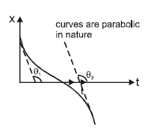
The position-time graph of two objects A and B is shown in the figure. What is the ratio of the velocities of object A with the velocity of object B?
A particle moves in plane from positions to in . Magnitude and direction of average velocity is
The velocity of a particle varies with displacement as Where and are constants. The acceleration of the particle is
In negative acceleration the velocity of a body
The formula for finding acceleration is:
Acceleration is defined as the rate of change of_____
What is Dimensional Formula of Acceleration and its Derivation?
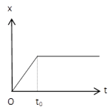
An object is moving along -axis. If its position (in meter) at any time (in ) is given by the following graph, then the object is at rest about

Which of the following best represents a velocity time graph corresponding to the position time graph shown ?
If the height can be expressed as , the value of after is
In projectile motion, the height of the object varies with respect to time.
The speed of a train increases at a constant rate from zero to and then remains constant for an interval and finally decreases to zero at a constant rate . The total distance travelled by the train is . The time taken to complete the journey is . Then,
At time , a car moving along a straigt line has a velocity of . It slows down with an acceleraion of , where is in second. Mark the correct statement (s).
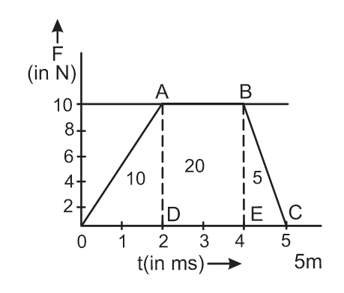
A force hits a block of mass initially at rest. The duration of the impact is . It the force varies with time as shown in figure, the speed of block immediately after impact is
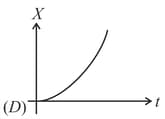
The figure given below shows the displacement () – time () graph of a particle moving on the - axis. Select the correct option from the following which best represents the graph.
An object starts moving with uniform acceleration from rest. Initially, it was at origin. Then which of the following graphs are correct.
(A) 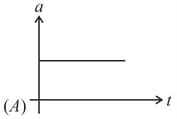
(B) 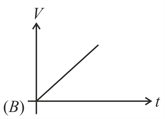
(C) 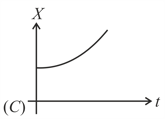
(D)