Velocity - Time Graphs
Important Questions on Velocity - Time Graphs
What can you say about the motion of a body, if its velocity-time graph is parallel to the time axis?
A car is moving on a straight road with uniform acceleration. The speed of the car varies with time as follows:
| Time | ||||||
| Speed |
Draw the speed-time graph by choosing a convenient scale. Determine from it:
The distance traveled by the car in seconds.
Name the quantity, the slope of whose graph against time gives acceleration.
Given below are some speed-time graphs. In which of the graphs,
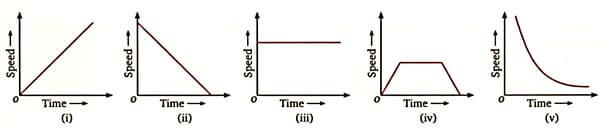
(a) speed is constant.
(b) speed is increasing
(c) speed is decreasing
(d) What happens in (iv)?
(e) What happens in (v)?
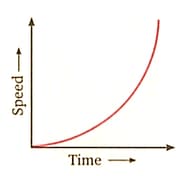
What conclusion can you draw about the acceleration of a body from the speed-time graph shown in figure.
What can you say about the motion of a body if its speed-time graph is straight line parallel to the time axis?
Three speed-time graphs are given below:
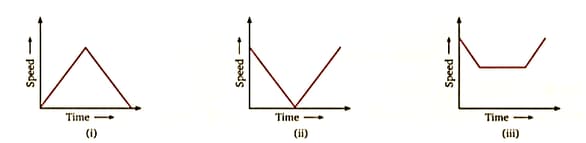
Which case represents the case of:
(a) a ball is thrown vertically upwards and returns to the hand of the thrower?
(b) a body decelerating to a constant speed then accelerating uniformly?
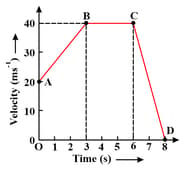
Figure shows the velocity-time graph for the objects and , moving along the same direction. Which object has greater acceleration?

What does the slope of a speed-time graph indicate?
A car is moving on a straight road with uniform acceleration. The speed of the car varies with time as follows:
| Time | ||||||
|---|---|---|---|---|---|---|
| Speed |
Draw the speed-time graph by choosing a convenient scale. Determine from it:
acceleration of the car
The graph given in figure shows how the speed of a train changes with time. Find the distance traveled in first hours.
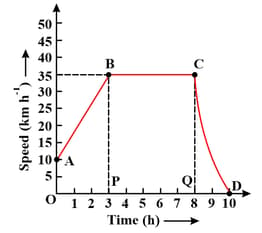
The graph given in figure show how the speed of a train changes with time. Which part of the graph shows varying retardation?

The graph given in figure show how the speed of a train changes with time. Which part of the graph show zero acceleration?

The graph given in figure show how the speed of a train changes with time. Which part of the graph shows uniform acceleration?
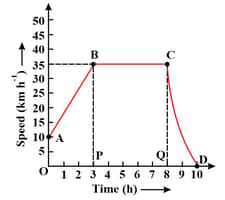
The graph given in figure shows how the speed of a train changes with time. What is the maximum speed attained by the train?

The graph given in figure shows how the speed of a train changes with time. What is the initial speed of the train?

The speed-time graph of an ascending passenger lift is given below. Find the acceleration of the lift during the last two seconds.
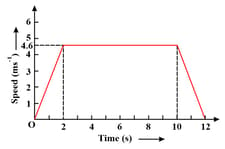
The speed-time graph of an ascending passenger lift is given below. Find the acceleration of the lift between second and tenth second

The speed-time graph of an ascending passenger lift is given below. Find the acceleration of the lift during the first two seconds

From the velocity-time graph shown in figure find acceleration of the body between and .