
Line Spectra
Important Questions on Line Spectra
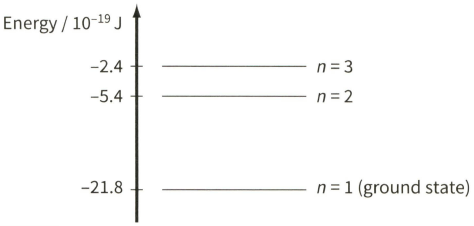
The diagram shows three of the energy levels in an isolated hydrogen atom. The lowest energy level is known as the ground state.

In the diagram, each energy level is labelled with its 'principal quantum number' $n$. Use the energy level diagram to show that the energy $E$ of an energy level is inversely proportional to $n^{2} .$
The diagram shows three of the energy levels in an isolated hydrogen atom. The lowest energy level is known as the ground state.
Explain why a photon is emitted when an electron makes a transition between energy levels $n=3$ and $n=2 .$
The diagram shows three of the energy levels in an isolated hydrogen atom. The lowest energy level is known as the ground state.
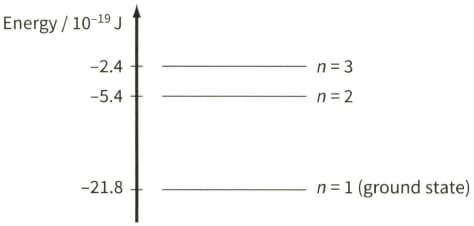
Explain what happens to an electron in the ground state when it absorbs the energy from a photon energy $21.8 \times 10^{-19} \mathrm{~J}$.
The spectrum of sunlight has dark lines. These dark lines are due to the absorption of certain wavelengths by the cooler gases in the atmosphere of the Sun.
The diagram shows some of the energy levels of an isolated atom of helium.

All the light absorbed by the atoms in the Sun's atmosphere is re-emitted. Suggest why a dark spectral line of wavelength of $590 \mathrm{~nm}$ is still observed from the Earth.
The spectrum of sunlight has dark lines. These dark lines are due to the absorption of certain wavelengths by the cooler gases in the atmosphere of the Sun.
The diagram shows some energy levels of an isolated atom of helium.

Explain, with reference to the energy level diagram, how a dark line in the spectrum may be due to the presence of helium in the atmosphere of the Sun.
The spectrum of sunlight has dark lines. These dark lines are due to the absorption of certain wavelengths by the cooler gases in the atmosphere of the Sun.
The diagram shows some energy levels of an isolated atom of helium.
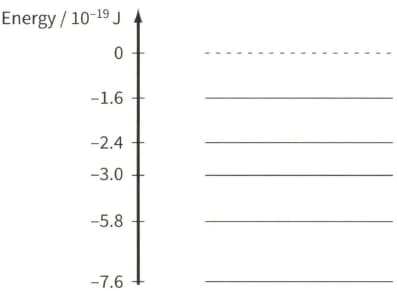
Explain the significance of the energy levels having negative values.
Figure 28.20 shows another energy level diagram. In this case, energy is given in electronvolts (eV). The list shows the energies of some photons: . State and explain which of these photons will be absorbed by the electrons.
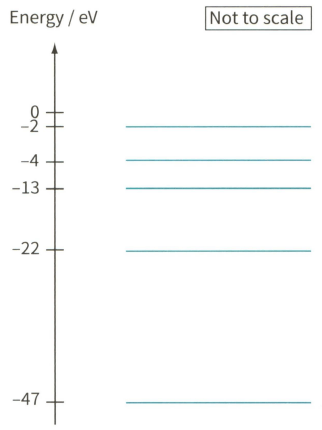
An energy level diagram.


