
Tabulations and Tables
Tabulations and Tables: Overview
This topic covers concepts, such as, Tabular Representation of Data, Parts of a Table in Data Interpretation, Speed and Distance & Advantages of Tabular Representation etc.
Important Questions on Tabulations and Tables
Study the following table carefully to answer the question that follows:
Number of Articles (In ) Manufactured and Sold by Six Different Companies
| Year/Company |
Mfd. |
Sold |
Mfd. |
Sold |
Mfd. |
Sold |
Mfd. |
Sold |
Mfd. |
Sold |
Mfd. |
Sold |
What is the average number of articles not sold by all companies together in the year
Study the table carefully to answer the question that follows:
A number of students appeared (A) and qualified (Q) in an examination from various institutes over the years.
| YEARS | ||||||||||
| Institutes | A | Q | A | Q | A | Q | A | Q | A | Q |
| B | ||||||||||
| C | ||||||||||
| D | ||||||||||
| E | ||||||||||
| F | ||||||||||
What is the percentage of candidates qualified over the number of candidates who appeared for the exam in the years from all institutes together (rounded off to two digits after decimal)?
Read the following table carefully and answer the questions given below.
NUMBER OF STUDENTS STUDYING DIFFERENT SUBJECTS IN DIFFERENT SCHOOLS.
| School | Hindi | English | Maths | Physics | Chemistry | Biology |
| P | 24 | 36 | 39 | 48 | 14 | 19 |
| Q | 19 | 21 | 26 | 43 | 9 | 11 |
| R | 26 | 14 | 14 | 38 | 7 | 22 |
| S | 9 | 16 | 38 | 33 | 8 | 9 |
| T | 22 | 26 | 49 | 41 | 21 | 13 |
| U | 16 | 19 | 17 | 48 | 26 | 32 |
| W | 14 | 18 | 19 | 33 | 16 | 6 |
The number of students studying physics in school U is approximately what percent more than the number of students studying the same subject in school S?
Read the following table carefully and answer the questions given below.
| Investment in 7 sectors in a different year (in crore Rs.) | ||||||||
| Sector | 2011 | 2012 | 2013 | 2014 | ||||
| Domestic | Foreign | Domestic | Foreign | Domestic | Foreign | Domestic | Foreign | |
| Industry | 6000 | 1500 | 4000 | 3000 | 1000 | 1500 | 5000 | 2000 |
| Cement | 4000 | 1800 | 5000 | 2800 | 3000 | 2500 | 3000 | 1600 |
| Metal | 1500 | 500 | 3200 | 2200 | 3500 | 2000 | 4000 | 2800 |
| Machinery | 1000 | 1500 | 3600 | 6000 | 2500 | 3000 | 2000 | 3000 |
| Transport | 4000 | 1000 | 3000 | 1600 | 1500 | 3200 | 2500 | 2000 |
| Fuel | 1200 | 2000 | 1500 | 5000 | 1000 | 2800 | 1500 | 2500 |
| Chemical | 2000 | 3000 | 2400 | 3200 | 500 | 4000 | 3500 | 1000 |
What is the respective ratio of investment in industry and cement in all the given years?
Study the following table carefully to answer the question that follows:
Number of Officers (in thousands) passed out from five different academies during six different years.
ACADEMICS
| Years | Air Force | Army | Navy | Coast Guard | BSF |
| 2004 | 1.4 | 4.2 | 0.6 | 1.7 | 2.6 |
| 2005 | 1.7 | 5.1 | 0.9 | 2.8 | 3.1 |
| 2006 | 0.9 | 7.7 | 1.2 | 1.6 | 4.7 |
| 2007 | 2.4 | 3.6 | 1.8 | 4.7 | 5.8 |
| 2008 | 1.3 | 4.5 | 2.9 | 5.1 | 6.4 |
| 2009 | 2.7 | 3.9 | 3.5 | 3.9 | 4.3 |
In the following table, numbers of people using various music accessories from various cities are given. Study the table carefully and answer the question given below.
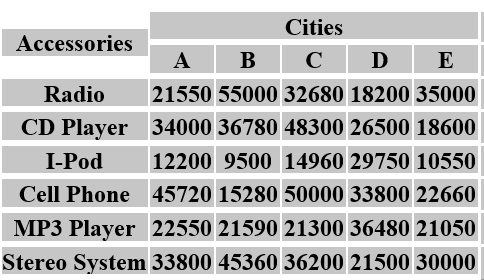
What is the difference between the total number of people using various music accessories from city B and the total number of people using various music accessories from city E?
Study the following table carefully and answer the questions given below it.
Number of Entertainment Shows held in various cities in a year (Number in Hundreds)
| Cities | Dance | Musics | Drama | Standup Comedy | Mimicry |
| M | 15 | 21 | 24 | 0.8 | 0.9 |
| N | 12.4 | 13 | 26 | 2 | 0.8 |
| O | 5.7 | 8 | 12 | 0.3 | 0.2 |
| P | 11.3 | 6 | 18 | 1 | 1.5 |
| Q | 17 | 12.4 | 11 | 3 | 0.4 |
| R | 14 | 10.5 | 9.8 | 0.7 | 0.1 |
The mimicry shows held in city M are what percent of the drama shows held in city O?
Study the following table and answer accordingly to the questions.
Production of the main crops in India (In million tonnes)
| Year | ||||||
| Crop | ||||||
| Rice | ||||||
| Sugarcane | ||||||
| Wheat | ||||||
| Pulses | ||||||
| Oilseeds | ||||||
| Coarse gran | ||||||
Production of which crop in increased every year?
Study the following table carefully and answer the questions given below.
| Installed - capacity and production of vehicles over the year | ||||||
| Category | Installed Capacity | Production | ||||
| 2000 | 2001 | 2002 | 2000 | 2001 | 2002 | |
| Tempos | 70 | 79 | 89.5 | 41.2 | 51.8 | 58.6 |
| Cars | 47.5 | 54.4 | 53 | 36.6 | 33.6 | 30.3 |
| Jeeps | 14 | 14 | 14 | 10.58 | 12 | 13.3 |
| Motor Bikes | 77.5 | 77.5 | 80 | 68 | 96.9 | 98 |
| Scooters | 150 | 150 | 200 | 100.4 | 150 | 120.5 |
| Autos | 29 | 30.3 | 32 | 18.4 | 19.4 | 15.1 |
Which of the following statements are true?
I. All categories of automobiles experienced a growth in production between and .
II. In the capacity utilization of jeeps was higher than that of motor bikes.
III. Cars, Scooters and Auto experienced a decline in production from to .
Study the following table carefully to answer the question:
Population (in lakhs) of three states over the years
| Year State |
2007 | 2008 | 2009 | 2010 | 2011 | 2012 |
| A | 3.5 | 4.8 | 6.5 | 5.6 | 5.8 | 6.4 |
| B | 4.5 | 3.6 | 3.2 | 3.2 | 4.2 | 4.4 |
| C | 5.6 | 5.6 | 5.8 | 5.2 | 5.6 | 6.8 |
Study the following tables carefully and answer the questions given below them.
The number of candidates who appeared in a competitive examination from five centres over the year.
| CENTRE | Mumbai | Delhi | Kolkata | Hyderabad | Chennai |
| YEARS | |||||
| 2001 | 35145 | 65139 | 45192 | 51124 | 37346 |
| 2002 | 17264 | 58248 | 52314 | 50248 | 48932 |
| 2003 | 24800 | 63309 | 56469 | 52368 | 51406 |
| 2004 | 28316 | 70316 | 71253 | 54196 | 52315 |
| 2005 | 36503 | 69294 | 69632 | 58360 | 55492 |
| 2006 | 29129 | 59216 | 64178 | 48230 | 57365 |
| 2007 | 32438 | 61345 | 56304 | 49178 | 58492 |
An approximate percentage of candidates qualified to appear in the competitive examination from five centres over the years.
| Mumbai | Delhi | Kolkata | Hyderabad | Chennai |
| 12 | 24 | 18 | 17 | 9 |
| 10 | 28 | 12 | 21 | 12 |
| 15 | 21 | 23 | 25 | 10 |
| 11 | 27 | 19 | 24 | 8 |
| 13 | 23 | 16 | 23 | 13 |
| 14 | 20 | 21 | 19 | 11 |
| 16 | 19 | 24 | 20 | 14 |
Approximately how many candidates appearing from Kolkata in qualified in the competitive examination?
Study the following table carefully to answer the question that follow.
Semester fees (In thousand ) for different courses in the six different years.
| Course | |||||
| Years | B.Tech | M.Sc | B.Ed | M.Phil | Diploma |
| 2006 | 11.5 | 5.8 | 7.5 | 4.7 | 1.8 |
| 2007 | 14.5 | 6.4 | 11.6 | 5.8 | 3.2 |
| 2008 | 20 | 10.2 | 13.9 | 8.6 | 4.8 |
| 2009 | 22.2 | 14.6 | 15.8 | 12.7 | 5.6 |
| 2010 | 35.8 | 17.7 | 18.5 | 25.1 | 12.5 |
| 2011 | 50.7 | 20.9 | 22.6 | 18.9 | 14.9 |
What was the average semester fee charged for M.Sc. course over all the years together?
Study the table carefully to answer the questions that follow.
Profit (in ) made by six different shopkeepers over the months
| Month Shopkeeper |
October |
November |
December |
January |
February |
March |
| P | ||||||
| Q | ||||||
| R | ||||||
| S | ||||||
| T | ||||||
| U |
What was the average profit earned by shopkeeper R in the months of October and November together?
Study the following table carefully to answer the question that follows.
Number of Students Appeared (A) and Failed (F) in Five Classes of a School over the Years.
| CLASSES | ||||||||||
| Year | VI | VII | VIII | IX | X | |||||
| A | F | A | F | A | F | A | F | A | F | |
| 2002 | 68 | 12 | 67 | 09 | 75 | 11 | 84 | 07 | 78 | 09 |
| 2003 | 65 | 19 | 70 | 11 | 63 | 08 | 69 | 05 | 79 | 12 |
| 2004 | 75 | 06 | 62 | 13 | 69 | 07 | 70 | 06 | 65 | 17 |
| 2005 | 79 | 12 | 76 | 10 | 67 | 13 | 81 | 05 | 74 | 08 |
| 2006 | 63 | 10 | 87 | 14 | 82 | 12 | 64 | 16 | 63 | 12 |
| 2007 | 72 | 15 | 66 | 04 | 74 | 15 | 70 | 07 | 82 | 04 |
| 2008 | 60 | 05 | 60 | 07 | 77 | 05 | 71 | 06 | 75 | 06 |
Study the following table carefully to answer the question that follows.
Percent rise in production of Six companies over the years:
| Year | P | Q | R | S | T | U |
If the production of Company S in the year was units, what was its production in the year ?
The following table shows the number of new employees added to different categories of employees in a Company and also the number of employees from these categories who left the company every year since the foundation of the Company in .
| Year | Managers | Technicians | Operators | Accountants | Peons | |||||
| New | Left | New | Left | New | Left | New | Left | New | Left | |
| - | - | - | - | - | ||||||
For which of the following categories the percentage increase in the number of employees working in the Company from to was the maximum?
Attempt these questions based on fuel consumption data of M/s ABC Transportation Company Limited given in the table.
| Year | Budgeted Consumption (Lakh liters) |
Actual consumption (Lakh liters) |
Km run (Lakh) | Fuel Expenditure (Rs. in Lakh ) |
| 2001 | 125 | 112 | 672 | 504 |
| 2002 | 150 | 170 | 1105 | 901 |
| 2003 | 200 | 225 | 1406 | 1125 |
| 2004 | 200 | 195 | 1209 | 995 |
| 2005 | 250 | 253 | 1594 | 1240 |
- Km per litre = Km Run/Actual Consumption
- Fuel Cost per Km = Fuel Expenditure/Km Run
- Fuel Cost per litre = Fuel Expenditure/Actual Consumption
Read the following table carefully and answer the questions given below.
Highest marks and average marks obtained by students in different subjects over the years.
The maximum mark in each subject is 100.
| Subjects | ||||||||||
| Physics | Chemistry | Maths | Hindi | English | ||||||
| Highest | Average | Highest | Average | Highest | Average | Highest | Average | Highest | Average | |
What was the approximate percent increase/decrease in average marks in English from and ?
Study the following table carefully to answer these questions.
Number of students who appeared and passed in an examination from five different schools over the years are given below:
| School | A | B | C | D | E | |||||
| YEAR | App. PASS | App. PASS | App. PASS | App. PASS | App. PASS | |||||
What is the ratio between average number of students passed from Schools B and C respectively for all the given years?
Study the table carefully to answer the questions that follow the Number of cars (in a thousand) of two models (Basic and Premium) produced by five different companies in five different years
| company | A | B | C | D | E | |||||
| Year | basic | Premium | basic | Premium | basic | Premium | basic | Premium | basic | Premium |
| 2006 | ||||||||||
| 2007 | ||||||||||
| 2008 | ||||||||||
| 2009 | ||||||||||
| 2010 | ||||||||||
What was the average number of cars of premium model produced by Company A over all the years together?


