
Line Graphs
Line Graphs: Overview
This topic covers concepts such as Structure of Line Graphs, Formation of Line Graphs from Bar Graphs, Formation of Data Table from Line Graph, Line Graphs with Uniform Intervals, Line Graphs with Non-uniform Intervals, etc.
Important Questions on Line Graphs
Study the following graph carefully to answer these questions.
Investments (in ) of two business partners and .
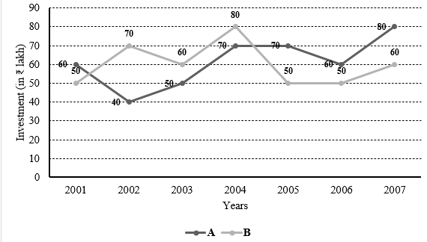
What was the percent rise in investment in from the previous year?
Study the data presented in the following graph to answer these questions.
Monthly Expenditure of a firm from January to July during the years
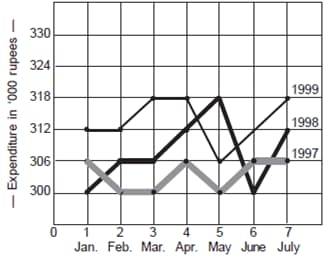
Which of the following statements is correct ?
Directions: Study the graph carefully to answer the questions that follow
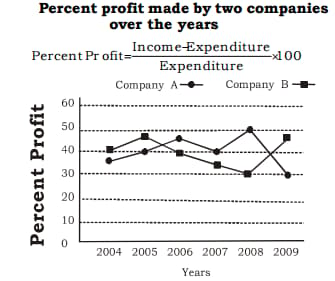
If the amount of profit earned by Company A in the year was Rs lakhs, what was its expenditure in that year?
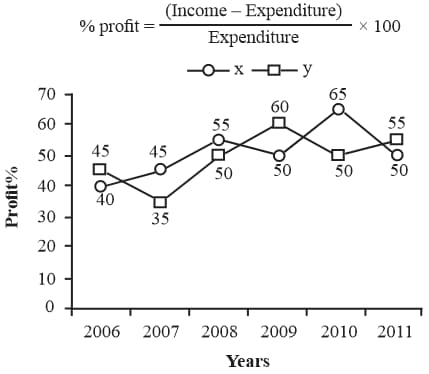
The following line graph shows the Income and Expenditure of a company over the years. Study it carefully and answer the questions.
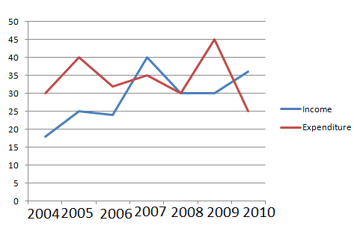
In which of the following years is the ratio of income to expenditure the maximum for a company?
Study the following line graph carefully --
Exports from Three Companies Over the Years (in Pesetas).
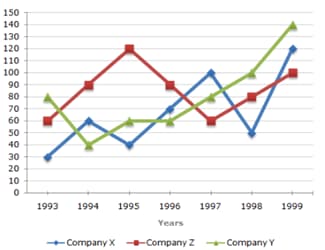
What was the difference between the average exports in and the average exports of the three Companies in ?
Read the following graph carefully and answer the questions given below.
Ratio of import and export of a company in different years
The import in is what percent more than the export in that year?
Study the data presented in the following graph to answer these questions.
Monthly Expenditure of a firm from January to July during the years

The expenditure in May was ___ less than that of the corresponding period in .(Round off to the nearest integer).
Study the following graph carefully to answer the questions that followed. The following line graph gives distance (in ) travelled by five different trucks in a day.
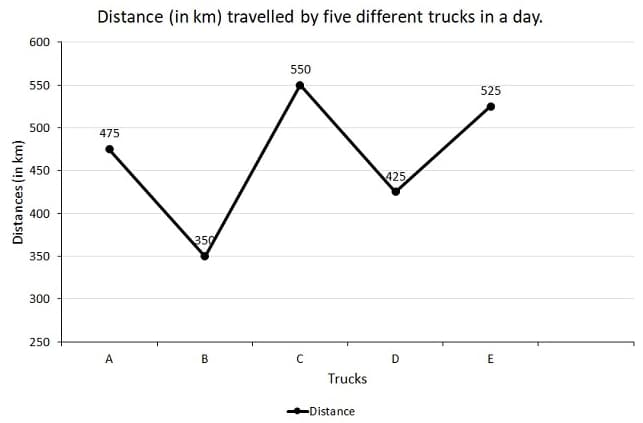
What is the respective ratio of the distance travelled by truck A to the distance travelled by truck D?
Read the following graph and answer the questions given below-
The following graph shows the balance of three persons Uday, Vijay and Lokendra in a branch of IOB for the months of the year.
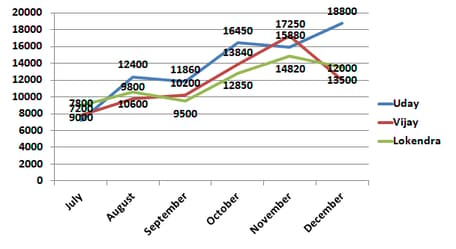
If the bank gives simple interest at the rate of per annum. Then how much interest Lokendra did get in months? (approx)
DIRECTIONS : The question is based on the graph given below:
Per cent profit earned by six companies during
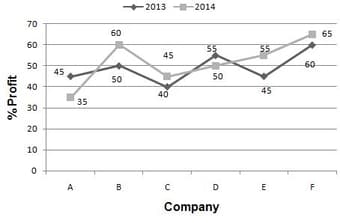
If the expenditures of Company in the years were the same, what was the ratio of the incomes of the company in the same years respectively?
Study the following graph carefully to answer the questions.
Investments (in lakh ₹) of two Business Partners X and Y over the years.
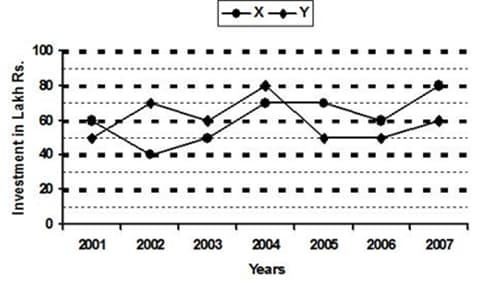
What is the ratio between total investment of X in and together and the total investment of Y in these three years together respectively?
Study the graph carefully and answer the following question.
Data related to Income (In Rs thousand) and Expenditure (in Rs thousand) of the company during six months.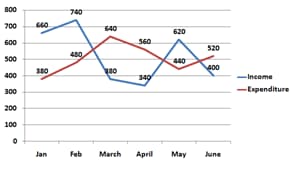
If company Expenditure increased by from June to July and income decrease by . What was his profit percent in the month of July?
Study the following graph carefully and answer the question below it.
Number of students (males and females) passed out from various colleges in a year (Number in thousands)
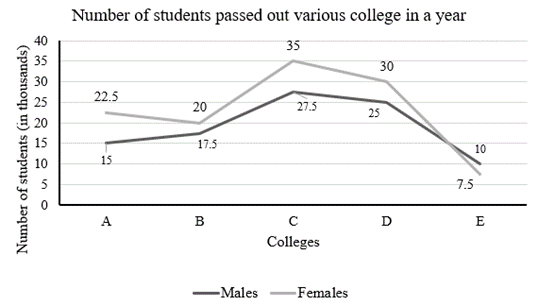
What is the difference between the total number of students passing out from college and the total number of students passing out from college ?
Answer the question based on the following information:
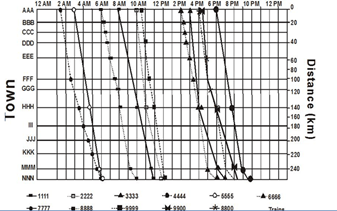
Which is the fastest train between HHH and NNN?
Read the following graph carefully and answer the questions given below.
Import by companies in different years (in)
What is the difference between the import of company A in and that of company B in ?(in )
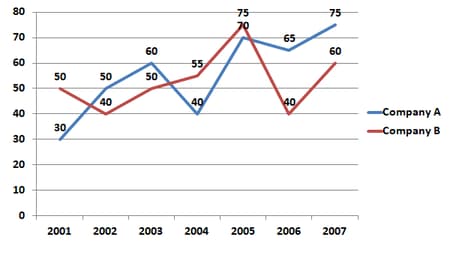
The following line graph gives the percent profit earned by two companies and during the period to .
Percentage profit earned by two companies and over the given years.
If the income of two companies were equal in , then what was the ratio of expenditure of company to that of company in ?
Study the following graph carefully and answer the questions.
Number of trains cancelled from three different states in five different years.
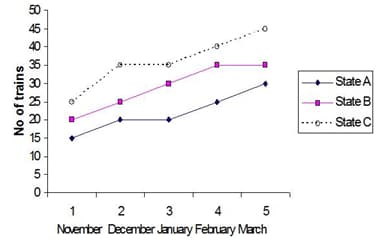
What is the total number of trains cancelled from state B over all the months together?
Study the following graph carefully and answer the questions.
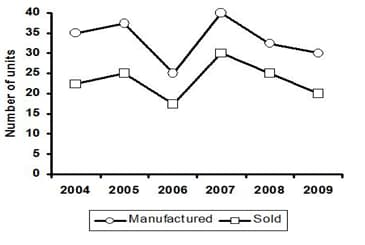
What is the difference between the number of unsold units of the company in the year and the number of unsold units of the company in the year ?
Study the data presented in the following graph to answer these questions.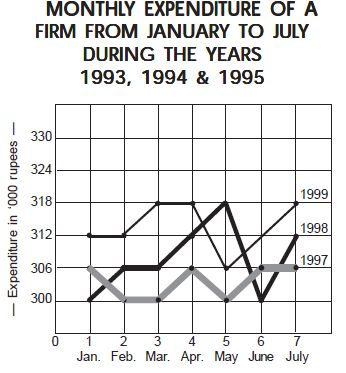
What total expenditure has been made during the year 1997 and 1998 in the period covered in the graph ?
Study the following graph carefully to answer the questions.
Investments (in lakh ₹) of two Business Partners X and Y over the years.
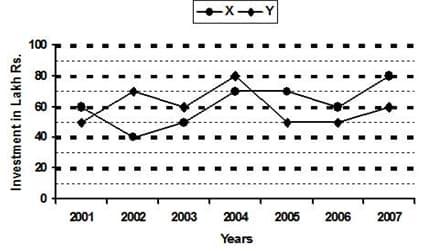
What was the percent rise in investment of Y in from ?


