Graphical Representation of Motion
Important Questions on Graphical Representation of Motion
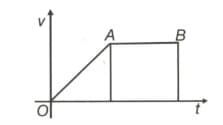
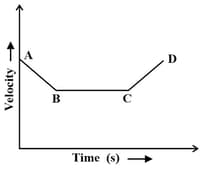
Which velocity-time graph shows a period of acceleration in the motion?
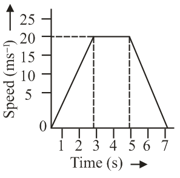
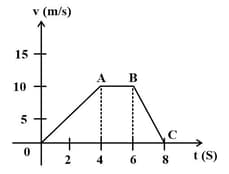
The figure gives the speed-time graph of the motion of a car. What is the ratio of the distance travelled by car during the last two seconds to the total distance travelled in seven seconds?
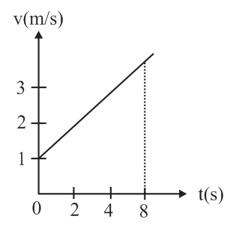
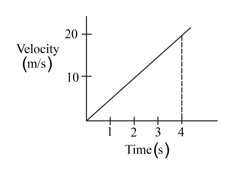
The velocity-time graph of a point mass moving in the +x-direction is shown below. The acceleration of the point mass is:
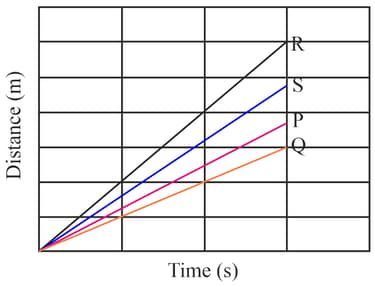
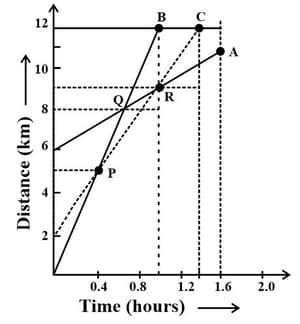
The distance-time graph of four bikes and which are moving on a straight road is shown in the given figure. Which of the following statement is correct regarding their motion.
Now, let’s find the acceleration for this interval using the formula. The acceleration will be:
Match the following and select the correct option.
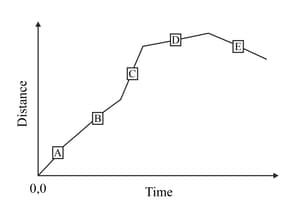
| A | I turn back towards the start of my walk | ||
| B | I start to walk at a constant speed | ||
| C | I feel tired so I slow down | ||
| D | I start to walk a little quicker | ||
| E | I start to walk downhill so my speed increases |
The area under velocity-time graph represents the
The velocity-time graph of a ball moving on the surface of a floor is given below.
If the mass of the ball is , then the value of force on the ball is
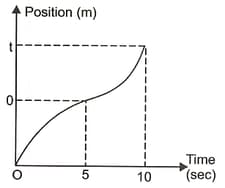
The below given position-time graph describes which of the given options:
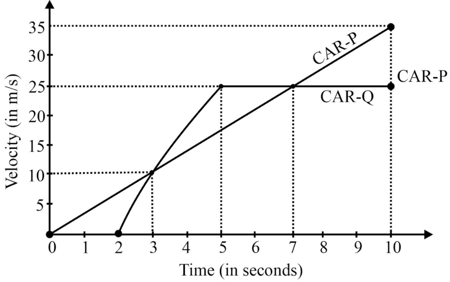
The given diagram shows velocity-time graphs of cars P and Q, starting from the same place and in the same direction.
Calculate the acceleration of car Q between in . (Give the answer in two decimal points)
When graph has negative slope, acceleration is _____. (negative / zero / positive)
Consider the graph shown in figure which of the following is correct?
Using the given graph, one can conclude:
A: Displacement in () seconds is equal to the displacement in () seconds.
B: Acceleration is in and zero in .
C: Acceleration is negative in time () seconds.
A teacher has a habit of walking to and fro between the left and right ends of the classroom at a uniform speed while lecturing. She pauses for a fixed interval of time, every time she reaches an end. Let the left and right ends of her path be at and respectively. If at she starts moving from the right end, which of the following graphs describes her motion?
The displacement-time graph for a body at rest is
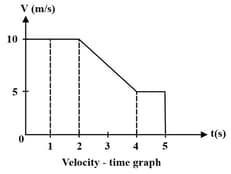
Find the distance travelled in seconds with the help of given graph.
What does the graph shown below indicate?
In below graph, when car B passes car A, the distance travelled by car C is:
The adjoining graph represents :
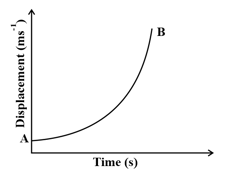
The curve AB of displacement-time graph represents :