Graphical Representation of Motion
Important Questions on Graphical Representation of Motion
The diagram shows the velocity-time graph of two moving cars . The graph indicates that
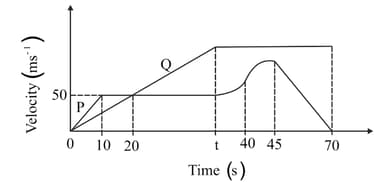
i) The velocity of car is increasing at a decreasing rate from in the same direction.
ii) Car is moving with a constant acceleration from .
iii) Acceleration of the car is not zero at any point during the whole journey.
iv) After , is behind .
Which of the following is correct?
The velocity-time graph of an object is shown in the figure. Identify the correct statement(s) regarding this graph.
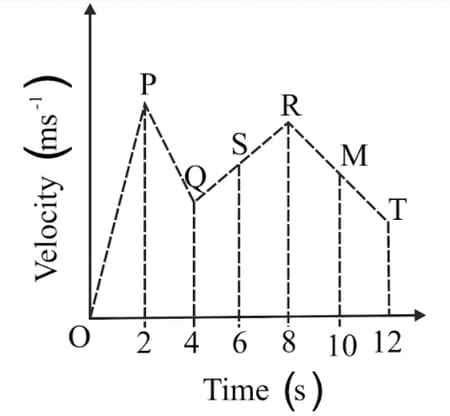
i) This is a non-uniform velocity-time graph of the object.
ii) The velocity of the object is increasing at the same rate during OP and QR.
iii) The velocity of the object is decreasing at the same rate during PQ and RT.
What would you conclude about the velocity-time graph of the cyclist from the given graph?
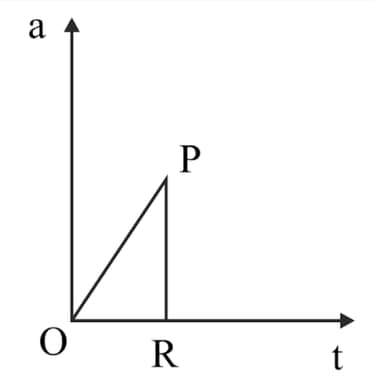
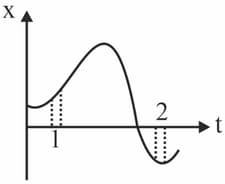
Figure shows the plot of a particle in one-dimensional motion. Two different equal intervals of time are shown. Let and be average speeds in time intervals and respectively. Then,
A dancer is demonstrating dance steps along a straight line. The position - time graph is given here.

A dancer is demonstrating dance steps long a straight line. The position - time graph is given here.
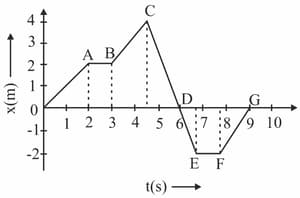
The average speed for the dance step depicted by is
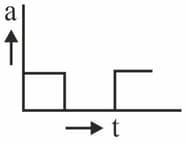
Which of the following would probably show the velocity-time graph for a body whose acceleration-time graph is shown in figure?