
Distance-Time Graph of Non-Uniform Motion
Distance-Time Graph of Non-Uniform Motion: Overview
Within this topic, we will examine the vision of distance and time in the non-uniform motion. Numerous activities and graphs are provided here to illustrate the concept of plotting the axis after evaluation.
Important Questions on Distance-Time Graph of Non-Uniform Motion
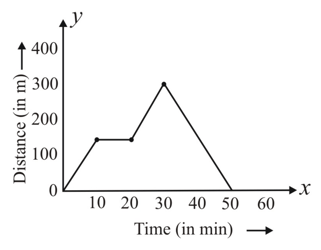
In the given figure, shows that the movement of an object across a playground. Read it and answer the given question:
How long the object was stationary? If the object was stationary for minutes, write as the final answer.
Draw a linear graph to illustrate the relationship between the amounts invested and the simple interest earned in one year if a bank gives interest at per annum for amounts up to . From the graph, find the simple interest earned in a year if the sum invested is .
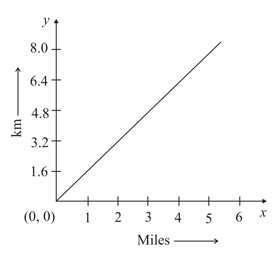
The graph in figure is a conversion graph between miles and kilometres. On the horizontal axis, represents . On the vertical axis, represents .
A man walks at the average speed of . What is his speed in miles per hour?
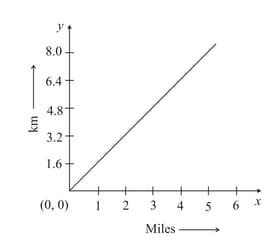
The graph in figure is a conversion graph between miles and kilometres. On the horizontal axis, represents . On the vertical axis, represents .
Priya's house is from the school. How much is the distance in miles?
The graph in figure is a conversion graph between miles and kilometres. On the horizontal axis, represents . On the vertical axis, represents .
A soldier walks miles. What is the distance covered by him in kilometres.
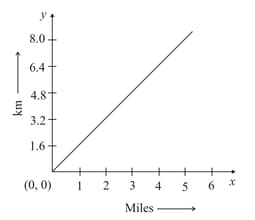
If the distance covered by him is , write as the final answer.
A man is riding a bike at a uniform speed of . Plot a distance-time graph to show the relationship between distance and time. Is it a linear graph?
The position of a particle moving along the x-axis at certain duration of time is given below.
| t(s) | ||||
| x(m) |
Which one of the following describes the motion correctly?


