
Graphical Representation of Motion
Graphical Representation of Motion: Overview
This topic covers concepts, such as Graphical Representation of Motion, Scale on a Graph, Plotting Single Line in a Line Graph, Graphical Representation of Data, Coordinate System in 2D, Axes of Coordinate System in 2D, x-axis of Coordinate System in 2D, y-axis of Coordinate System in 2D, Positive and Negative Sides of x-axis, Positive and Negative Sides of y-axis, The Origin of Coordinate System in 2D, Quadrants of Coordinate System in 2D, First Quadrant in Coordinate System, Second Quadrant in Coordinate System, Third Quadrant in Coordinate System, Fourth Quadrant in Coordinate System, Coordinate of a Point in Coordinate System in 2D, x - Coordinate of a Point in Coordinate System in 2D, y - Coordinate of a Point in Coordinate System in 2D, Plotting Points in Coordinate System in 2D, Slope of Straight Line, Position - Time Graphs, Slope of Distance-time Graphs, Displacement - Time Graphs, Acceleration in Displacement-Time Graphs, Speed-time Graph, Velocity-time Graphs, Slope of Velocity-time Graphs, Area under Velocity-time Graphs, Average Velocity in Graphs, Instantaneous Velocity in Graphs, Cases in Velocity-Time Graphs, Distance-Time Graph of Object at Rest, Distance Time Graph for Uniform Motion, Distance Time Graph for Non Uniform Motion & Comparison between Distance-time and Speed-time Graphs etc.
Important Questions on Graphical Representation of Motion
The area enclosed by velocity-time graph and time axis by an object moving with uniform motion represents :
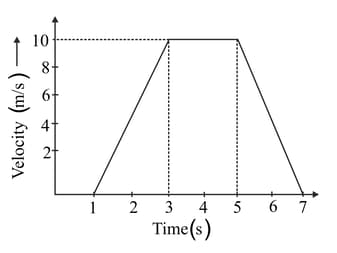
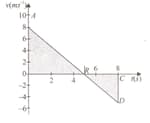
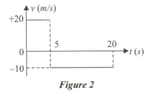
The distance travelled by a body in last two seconds of its motion in straight line is what fraction of the total distance covered in seconds in the given velocity time graph?
The velocity-time graph of an object moving with uniform velocity is
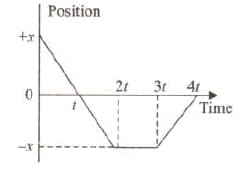
graph of the moving body in straight line is as shown in figure. Which among the following is not true?
The displacement-time graph of a body in motion is given as below:
Velocity of body is ( ) :
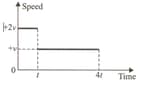
A body initially at rest start moving when a constant external force F is applied on it. The force F is applied for time t = 0 to time t = T. Which of the following graph represents the variation of the speed (v) of the body with time (t)
The displacement (in m) versus time (in s) graph for a car on a straight road is shown below.
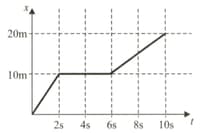
Which of the following statements is true?
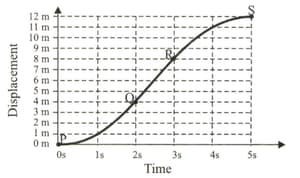
The time-displacement curve for a body of mass 1 kg in rectilinear motion is shown below. The curves PQ and RS are parabolas, while QR is a straight line. Column I lists three distinct time intervals, while Column II lists some statements about the motion of the body. For each item in Column I, match all the correct options in Column II.
Codes:
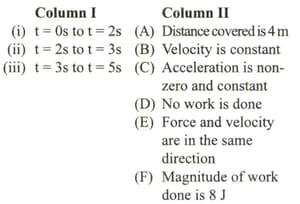
The position-time graph of the and and the velocity-time graph of the vehicle are as in the figure. Accordingly, which of these objects act under the effect of balanced forces?
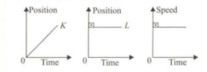
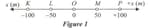
Position time graphs of K and L objects moving in parallel paths are shown in the figure given below.
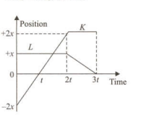
Which of following statements are correct?
1. The periods during which the vehicles are in motion are equal.
2. Once the vehicles are side by side.
3. The displacement of K is greater than that of L.
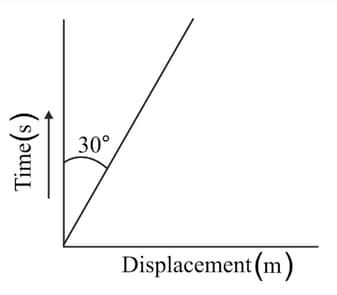
The average velocity of the bicycle, whose position—time graph is given, is m/s.
What is the average speed of the bike in m/s?
A train takes minutes to cover a distance of between two stations and Starting from rest at it accelerates at a constant rate to a speed of and maintains this speed until it is brought uniformly to rest at If the train takes three times as long to retard as it does to accelerate, then which of following statements
are correct.
Time to retard
Time to retard
A particle moves in a straight line. It has a velocity of when it is subjected to an acceleration of for seconds. It maintains a uniform velocity for seconds and is then brought to rest in a time of seconds.
1. Total distance covered
2. Acceleration between sec is
3. Magnitude of displacement sec is .
4. Magnitude of displacement sec is .
5. Distance average m sec is .
Which of above statements are correct?
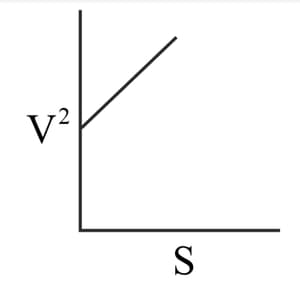
Study the graph and find which of the following is true.
Displacement
Distance travelled
Distance
Which of above statements are correct ?
The velocity-time graphs of the and Vehicles side by side at the time are as shown in the figure given below.
Which of the following statements are correct?
In the interval, sees moving away.
In the interval, the distance between
them is fixed.
During their movements, is always
ahead.
Which of above statements are correct?
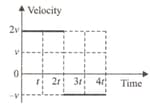
The velocity-time graph of an object .whose motion starts from with velocity in the direction of in a linear path like figure Study the two graphs.
At what point in the path is the object located seconds after the start of the motion?
The vehicle with constant velocity passes by the vehicle which is stopping at time . At time , vehicle accelerates smoothly and reaches vehicle at . How can speed-time graphs of vehicles be?
The velocity-time graph of a vehicle is like in the figure.
It has average speed in the interval is . What is the magnitude of its average velocity?
A vehicle moving along a linear road takes the road it will go in
Since the velocity-time graph of the vehicle is as shown in the figure, how many took the vehicle to the first half of the road?
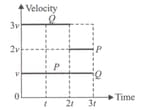
The velocity-time graphs of X and Y vehicles moving in a linear path are as shown in the figure.
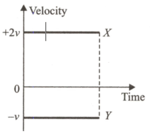
Which of following statements are absolutely correct?
Vehicles move in opposite directions.
The amount of displacement of vehicles per unit time is different.
Vehicles are moving away from each other.


