
Graphical Representation of Data
Graphical Representation of Data: Overview
This Topic covers sub-topics such as Frequency Polygon, Graphical Representation of Data, Drawing a Frequency Polygon, Histogram of Grouped Data, Histograms of Uniform Width, Class Marks for Frequency Polygon and, Understanding a Frequency Polygon
Important Questions on Graphical Representation of Data
Draw a histogram for the following data.
| C.I | 0-10 | 10-20 | 20-30 | 30-40 | 40-50 |
| Frequency | 3 | 7 | 10 | 6 | 4 |
Draw a double bar graph to compare the data in the given table:
Enrolment in computer courses
| Year/Course | Basic | Logo | Computer Science | Using Software |
| Year One | ||||
| Year Two |
Draw a histogram for the frequency distribution of the following data:
| Class Interval | |||||||
| Frequency |
Draw a histogram to represent the following grouped frequency.
| Age (in years) | |||||||
| No. of persons |
Also draw frequency polygon.
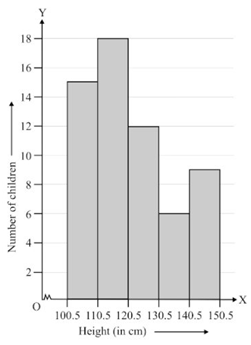
A random survey of the number of children of various age groups playing in a park was found as follows:
| Age | |||||||
| No. of children |
Draw a histogram to represent the data above.
What is the difference between class width and range
India first participated at the Olympic Games in , with a lone athlete Norman Pritchard winning two medals – both silver – in athletics and became the first Asian nation to win an Olympic medal. The nation first sent a team to the Summer Olympic Games in and has participated in every Summer Games since then. India has also competed at several Winter Olympic Games beginning in . Indian athletes have won medals, all at the Summer Games.

The number of medals which India won in the last six years in Summer Olympics Games is represented using the bar graph as shown below:

If the total number of medals won by India is , then the percentage of the medals won by India in to the total number of medals is
India first participated at the Olympic Games in , with a lone athlete Norman Pritchard winning two medals – both silver – in athletics and became the first Asian nation to win an Olympic medal. The nation first sent a team to the Summer Olympic Games in and has participated in every Summer Games since then. India has also competed at several Winter Olympic Games beginning in . Indian athletes have won medals, all at the Summer Games.

The number of medals which India won in the last six years in Summer Olympics Games is represented using the bar graph as shown below:
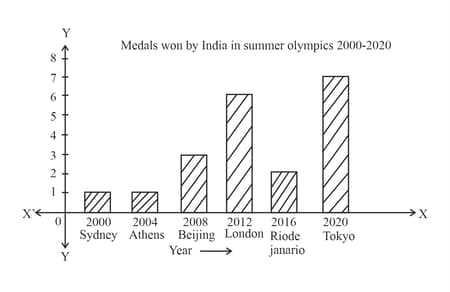
From the graph, the difference between the maximum number of medals won by India and the minimum number of medals won by India is
India first participated at the Olympic Games in , with a lone athlete Norman Pritchard winning two medals – both silver – in athletics and became the first Asian nation to win an Olympic medal. The nation first sent a team to the Summer Olympic Games in and has participated in every Summer Games since then. India has also competed at several Winter Olympic Games beginning in . Indian athletes have won medals, all at the Summer Games.

The number of medals which India won in the last six years in Summer Olympics Games is represented using the bar graph as shown below:

From the graph, the maximum number of medals won by India in
Coronavirus disease (COVID) is an infectious disease caused by the SARS-CoV virus.
Most of the people who got infected with this virus have experienced mild to moderate respiratory illness and recovered soon. But, some people have become seriously ill and required medical attention. Older people who have other medical conditions like diabetes, chronic respiratory disease, or cardiovascular disease etc. will be infected easily and develop serious illness. Anyone, at any age, can get sick with Coronavirus and become seriously ill or die.

During a survey, the ages of patients who are infected and admitted in a city hospital are recorded. The data is represented using the histogram as show below:

The class width of the given data is
India first participated at the Olympic Games in , with a lone athlete Norman Pritchard winning two medals – both silver – in athletics and became the first Asian nation to win an Olympic medal. The nation first sent a team to the Summer Olympic Games in and has participated in every Summer Games since then. India has also competed at several Winter Olympic Games beginning in . Indian athletes have won medals, all at the Summer Games.

The number of medals which India won in the last six years in Summer Olympics Games is represented using the bar graph as shown below:

The total number of medals won by India in Summer Olympics is
Coronavirus disease (COVID) is an infectious disease caused by the SARS-CoV virus.
Most of the people who got infected with this virus have experienced mild to moderate respiratory illness and recovered soon. But, some people have become seriously ill and required medical attention. Older people who have other medical conditions like diabetes, chronic respiratory disease, or cardiovascular disease etc. will be infected easily and develop serious illness. Anyone, at any age, can get sick with Coronavirus and become seriously ill or die.

During a survey, the ages of patients who are infected and admitted in a city hospital are recorded. The data is represented using the histogram as show below:
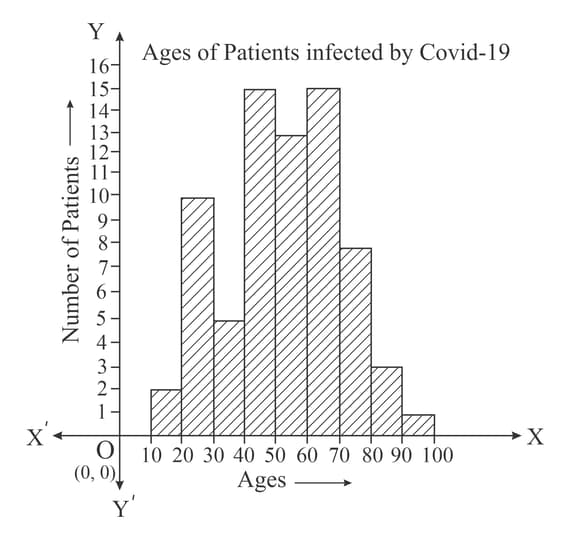
The age group of the highest number of patients infected by Covid is
The histogram represents quantitative data whereas bar graphs represent categorical data
Write any one difference between bar graph and histogram.
The graphical representation of the time series is known as:
The numbers of Science, Arts and Commerce graduates working in a company are , and respectively. If these figures are represented by a pie chart, then what is the angle corresponding to Science graduates?
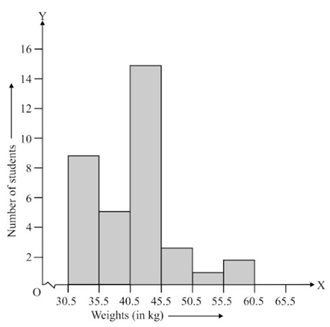
Explain why we need to use histograms of varying widths for the given data.
| Length | Frequency |
Explain why we need to use histograms of varying widths for the given data.
| Age | Frequency |
Consider the following Histogram:
There is a 'Kink' before the class interval on the horizontal axis. What does it mean?
Consider the following Histogram:
There is a 'Kink' before the class interval on the horizontal axis. What does it mean?


