
Introduction to Data Handling
Introduction to Data Handling: Overview
This Topic covers sub-topics such as Data, Data Handling, Representation of Data, Organising Data, Advantages of Recording Data in the Right Format, Collection or Recording of Data and, Importance of Organising Recorded Data
Important Questions on Introduction to Data Handling
Julian runs a bookshop. The table shows the number of books purchased by each of his last customers.
| Number of books | ||||||||||
| Number of customers |
Calculate the median number of books purchased by these customers.
Write any two advantages of recording data in right format
Twenty-Five cards were picked up from a pack of cards one by one. The cards picked up are as follows:
Spade, Club, Spade, Club, Spade, Spade, Club, Diamond, Heart, Club, Diamond, Club, Diamond, Club, Diamond, Spade, Diamond, Club, Spade, Diamond, Heart, Diamond, Heart, Club, Heart
What is the frequency of diamond?
Number of people in various age groups in a town is given in the following table:
| Age Group | above | |||||
| Number of people |
How many senior citizens are there in the town?
Number of people in various age groups in a town is given in the following table:
| Age Group | above | |||||
| Number of people |
How many age groups have the same population?
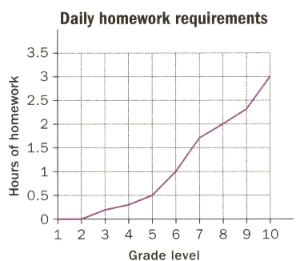
A study was done to collect data on the amount of homework required from students at a school in Canada.
Year 3 students in a school were asked for their grade in a science class, and about the use of their cell phone in the class.
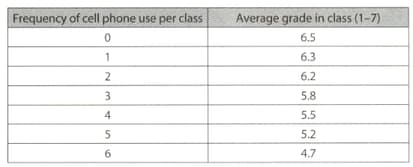
Explain how this data would impact your use of a cell phone in class.
Year 3 students in a school were asked for their grade in a science class, and about the use of their cell phone in the class.

Propose an explanation for the trends you see in the data.
Year students in a school were asked for their grade in a science class, and about the use of their cell phone in the class.

What trends do you see in the data? Justify your answer.
Year students in a school were asked for their grade in a science class, and about the use of their cell phone in the class.
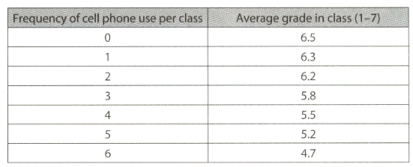
Draw any type of graph to represent the data. Discuss the effectiveness of graph.
This chart was used in an article that claimed, 'High school graduation rates have increased dramatically under new government!'
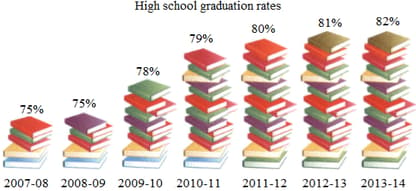
Explain whether you think the claim is justified from the graph or not.
We use bar graph for displaying _____ data.
The final marks obtained in Mathematics by students are as follows:
What is the range?
The frequency of is written symbolically as _____ using tally marks.
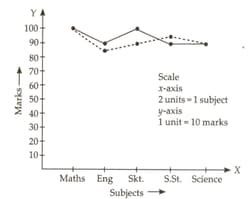
Tanvishi is one of the best students. Her predicted marks in class and her actual marks are shown in the graph.
The dotted line represents the predicted marks and the solid line represents the actual marks. In _____ she got more marks than the predicted marks.
The graph given below shows the maximum temperature during the last week of April. The maximum temperature was on
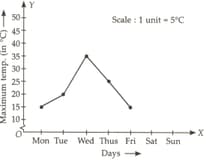
Observe the graph and answer the following questions.
The temperature is minimum at
Observe the graph and answer the following questions.
The temperature is maximum at
Observe the graph and answer the following questions.
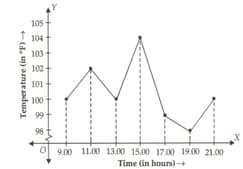
The temperature of the patient at hours is
Observe the graph and answer the following questions.
The temperature of the patient at hours is


