
Frequency Polygon
Frequency Polygon: Overview
This Topic covers sub-topics such as Frequency Polygon, Drawing a Frequency Polygon, Class Marks for Frequency Polygon, Relation between Histogram and Frequency Polygon, Characteristics of a Frequency Polygon and, Understanding a Frequency Polygon
Important Questions on Frequency Polygon
The length of the rectangle of histogram and the frequency are proportional to each other.
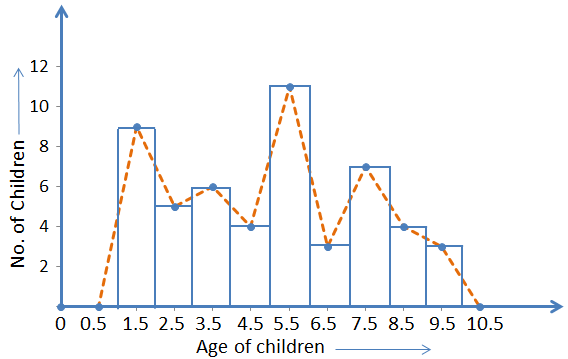
Frequency polygon is drawn after drawing the histogram of the collected data.
To draw frequency polygon we need to draw histogram first.
Frequency polygons can also be drawn independently without drawing histograms.
The class interval of a given observation is to , then the classmark for this interval will be
Show the following data by a frequency polygon.
| Electricity bill () | |||||
| Families |
Frequency polygons are used when the data is continuous and very large.
In frequency polygon, we join the mid-points of the upper sides of the adjacent rectangles of the histograms by means of line segments.
Frequency polygons can be drawn independently without drawing _____ .
What is the width of each rectangle in the histogram?

What is the area of the first rectangle (from left) of the histogram below?
What is the sum of area of all rectangles in the histogram below?

The frequency polygon shows the weight distribution of students in a student’s camp.
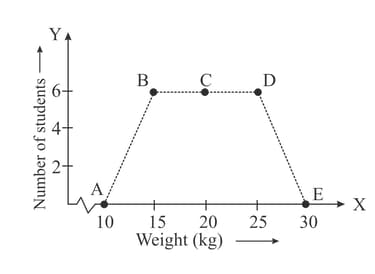
The number of students in the students’ camp is _____.


