
A sample was made of the animals on two rocky shores. Ten Quadrants were placed on each shore, and the number of animals of each species in each quadrant was counted.
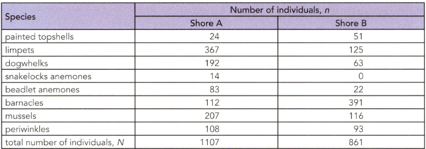
The Simpsons diversity Index of Shore A is 0.80 and the diversity of Shore B is 0.73. Compare the diversity of two shores.
Important Questions on Classification Biodiversity and Conversation
In a survey of trees in a dry tropical forest. Some students identified five tree species (A to E). They counted the numbers of trees in an area 100m * 1oo m. Their results are as follows:
A 56 B 48 C 12 D 6 E 3
Calculate the Simpson’s index for the trees within the area sampled.
In a survey of trees in a dry tropical forest. Some students identified five tree species (A to E). They counted the numbers of trees in an area 100 m * 100 m. Their results are as follows:
| Species | No. of individuals |
| A | 56 |
| B | 48 |
| C | 12 |
| D | 6 |
| E | 3 |
Looking at table write a set of instructions for making a kite diagram
An ecologist studied two species in an area and his observation are shown in the given table.
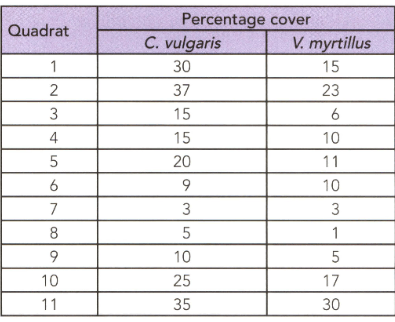
Draw a scatter graph to show the data in the table.
An ecologist studied two species in an area and his observation are shown in the given table.

Calculate Spearman's correlation coefficient for the data in this table.
An ecologist studied two species in an area and his observation are shown in the given table.

Calculate Spearman's correlation coefficient for the data in this table. Why the the ecologist was able to reject the null hypothesis.
An ecologist studied two species in an area and his observation are shown in the given table.

Calculate Spearman's correlation coefficient for the data in this table. State the conclusion that the ecologist can make from this investigation.


