The earnings of shops on a particular day are as follows (the figures have been estimated to the nearest hundreds):
Earnings (in )
Number of shops
Prepare a grouped frequency distribution table taking class interval of equal size, one such interval being .
Important Questions on Data Handling
The marks scored by students in a test are given below:
Complete the following frequency table:
| Marks in class intervals |
Tally marks |
Frequency |
What is the class interval in which the greatest frequency occurs?
Number of workshops organized by a school in different areas during the last five years are as follows:
| Years | Number of workshops |
Draw a histogram representing the above data.
The following histogram shows that the frequency distribution of the age of teachers in a school.
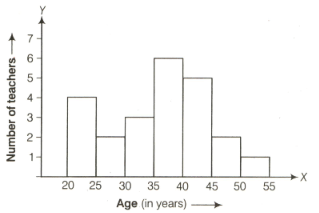
What is the number of eldest and youngest teachers in the school?
The following histogram show that the frequency distribution of the age of teachers in a school.

Which age group teachers are more in the school and which least?
The following histogram show that the frequency distribution of the age of teachers in a school.

What is the size of classes?
The following data represents the different type of animals and their numbers in a zoo. Prepare a pie chart for the given data.
| Animals | Number of animals |
| Deer | |
| Elephants | |
| Giraffe | |
| Reptiles | |
| Tiger |
For the development of basic infrastructure in a district, a project of crore approved by Development Bank is as follows:
| Item head | Road | Electricity | Drinking Water | Sewerage |
| Amount (in crore Rs) |
Draw a pie chart for the above data.
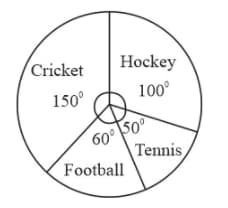
The pie chart (as shown) represents the amount spent on different sports by a sports club in a year. If the total money spent by the club on sports is , then find the amount spent on each sport.